
Important benchmarks
Track metrics that matter
Any business that cares about brand awareness and SEO should know that users are increasingly looking for quick-loading websites for an optimal user experience.
Uptrends monitors and reports Core Web Vitals metrics (CWV) in our Full Page Check monitor. Reported values can be classified as Good, Needs improvement, or Poor based on Google’s performance standards. Tracking CWV is essential for better overall page rankings and for shedding light onto the quality of end-user experience when interacting with your website.
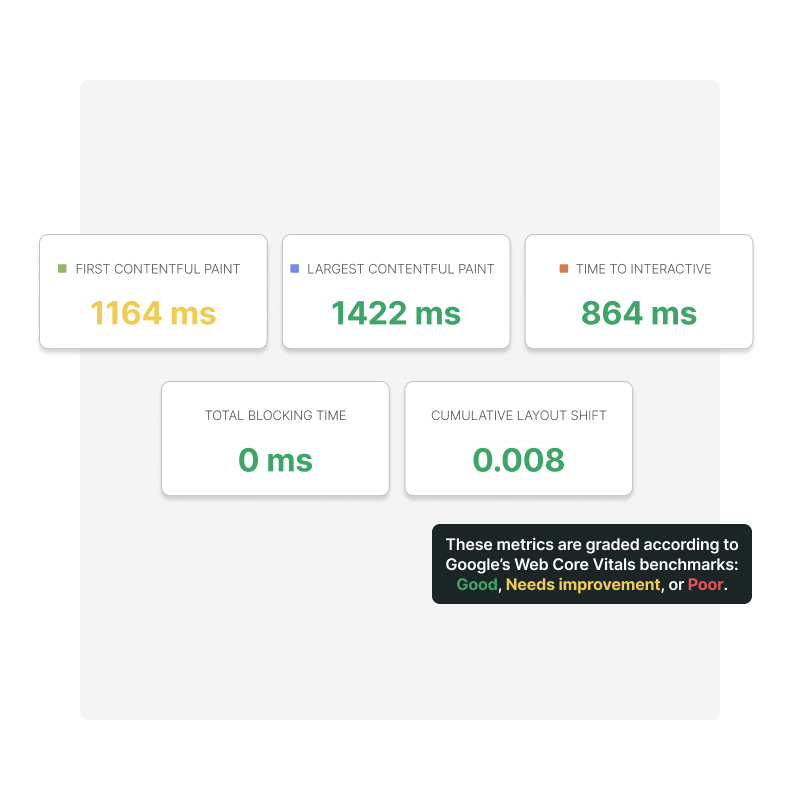
First Contentful Paint
First Contentful Paint (FCP) is an important user-centric CWV metric because it measures perceived page load speed. In other words, how long it takes during the page load timeline before users see something happening on the screen. In order to provide a good user experience, sites should routinely hit an FCP of 1.8 seconds or less.
Largest Contentful Paint
Largest Contentful Paint (LCP) may sound overly abstract but it simply refers to how fast meaningful content loads on your page. In particular, the time it takes for the largest single element to render on the page. To meet Google’s user experience standards, page content must load in less than 2.5 seconds. Anything slower affects your LCP score.
Time To Interactive
Measuring Time To Interactive (TTI) is important because some sites optimize content visibility at the expense of interactivity. This can create a frustrating user experience: the site appears to be ready, but when the user tries to interact with it, nothing happens.
Total Blocking Time
The Total Blocking Time (TBT) metric measures the total time between the First Contentful Paint (FCP) and the Time to Interactive (TTI). Any task that runs more than 50ms is considered “blocked”, which your users will perceive as a sluggish or unreliable.
Cumulative Layout Shift
Have you ever start reading an online article when something suddenly changes on the page? Cumulative Layout Shift (CLS) measures every unexpected layout shift that occurs during the lifespan of the page. Having page elements shift too much while a user is trying to interact with it leads to a bad user experience.
Measuring technique
Get performance metrics beyond Lighthouse
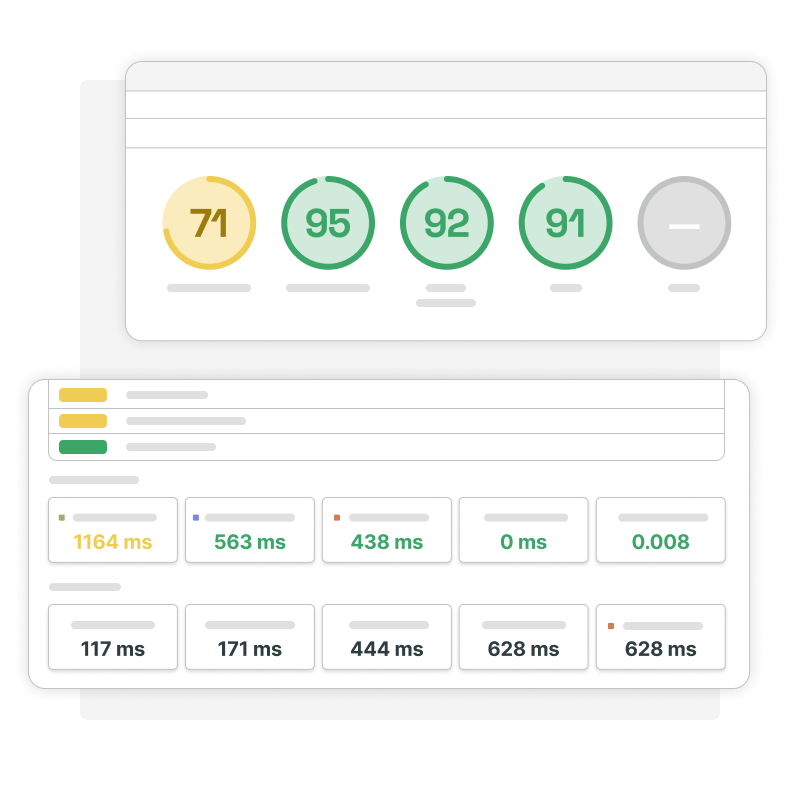
Lighthouse uses a different measuring technique than Uptrends, which runs a browser to visit a website just like a normal user would. After all, the goal is to gather data on user experience. But here’s why the Core Web Vitals reported by Lighthouse can differ from Uptrends' measurements:
- Lighthouse first runs a warmup then visits the site several times to determine an average.
- Lighthouse doesn’t trigger certain user input checks that our measuring technique and normal users do.
- Slower connections are simulated with throttling.
Monitor from 233 checkpoints
Our global network of checkpoints use the latest version of the Chrome browser for performance checks, allowing you to monitor your Core Web Vital metrics (and user experience) from around the world accurately.
Keep an eye out 24/7
FPC monitors can run a check every 5 minutes. Our native checks measures performance directly within the browser, which allows it to function as close to natural as possible. No more manual checks using Google Lighthouse.
Get the full picture
Inspect your website performance with detailed waterfall reports, where you can inspect load times on a elemental basis, together with custom screen sizes, mobile simulation with bandwith throttling and more!
Timeline of screenshots
Inspect how the page loads with our filmstrip
The ability to visualize a series of screenshots, from the browser, showing exactly what the page looked like at different points during its loading process is like finding monitoring gold.
Timeline screenshots, also called a filmstrip, provides the kind of clarity you see exactly where images are failing to load or if faulty scripts are bogging down the rest of the page.

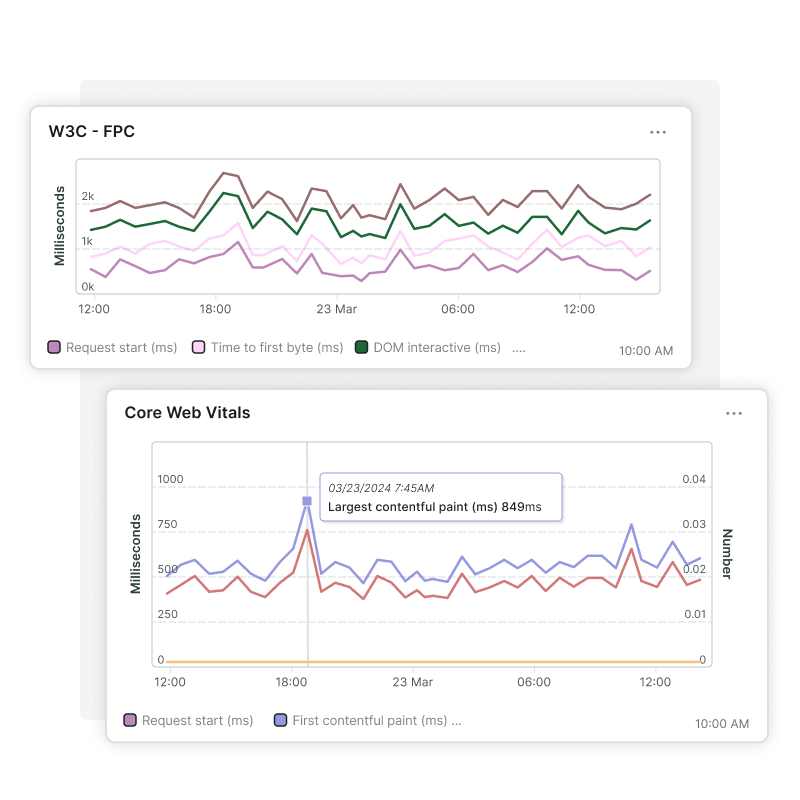
Combining CWV and W3C
View CWV and W3C timing metrics
Besides Google’s Web Core Vitals, Uptrends’ Full Page Check can also display a subset of W3C navigation timing metrics side-by-side in your dashboard. W3C metrics consists of:
- Request start
- Time to first byte
- DOM interactive
- DOM completed
- Load event
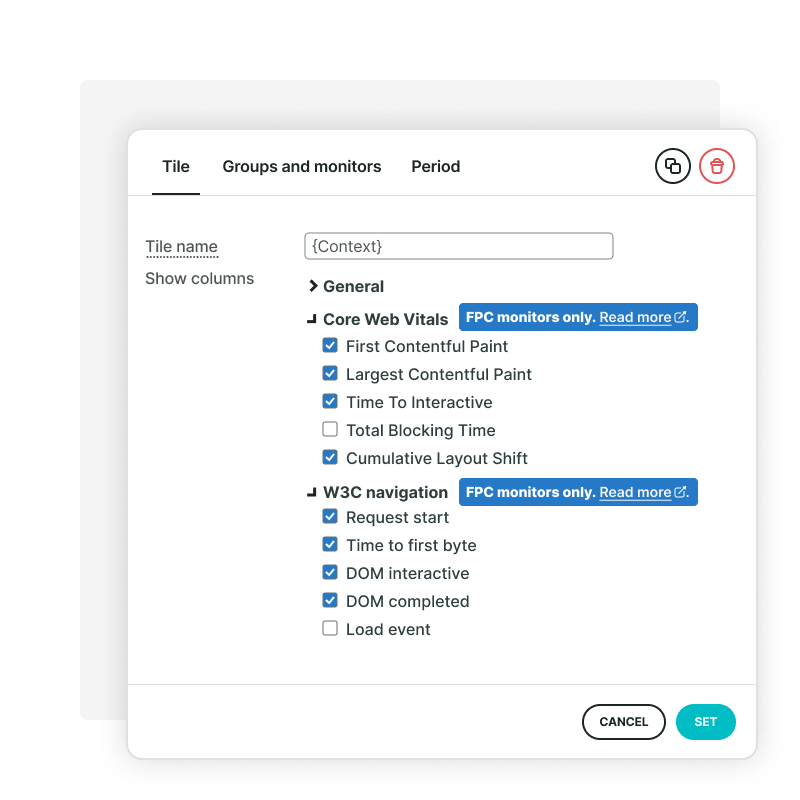
Full Page Check metrics available in custom tiles
The Full Page Check monitor with the browser type Chrome with extra metrics measures extra data for Core Web Vitals and W3C navigation timings. This data can now be shown on dashboards in a custom report tile of the type Simple data list / chart.
Start with monitoring your Core Web Vitals
These crucial benchmarks need to be monitored. Don’t let your page performance hold you back. Try Uptrends free for 30 days, without obligations. No commitment and no credit card required.
Start a free trial