
As APIs play a crucial role in your daily business, platform, and service operations, it is essential to regularly check their behavior and perform data validation. This article explains how you can use Custom metrics to monitor your API uptime, capture API response data, and visually display that data in real-time charts or lists for analysis.
Custom metrics is a feature available in Multi-step API (MSA) monitors that allows you to capture specific numerical data from any internal or external API. From each captured data point, you can store these values in a Custom metric variable to visually display how data progresses over time.
Why use custom metrics
Imagine you have an API for your e-commerce system that provides real-time information about your product catalog. This includes pricing details, product inventory, and other product information.
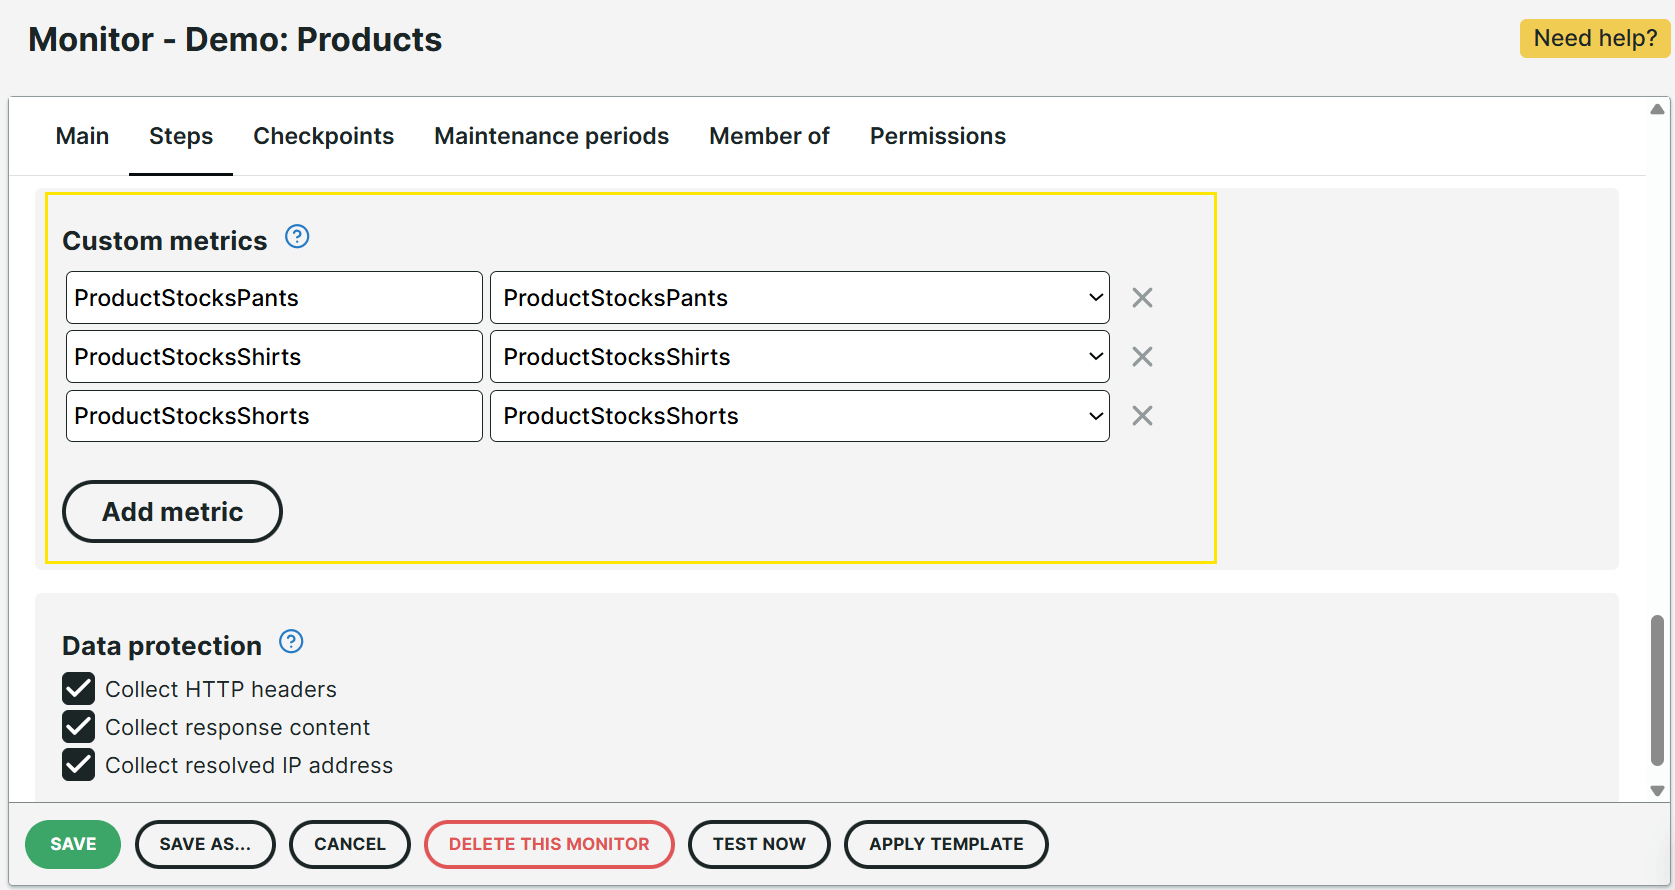
Let’s say you want to keep track of the number of stocks per product. Instead of manually calling the API every time, custom metrics automatically retrieve this data from the API response and store each data point in Custom metric variables:
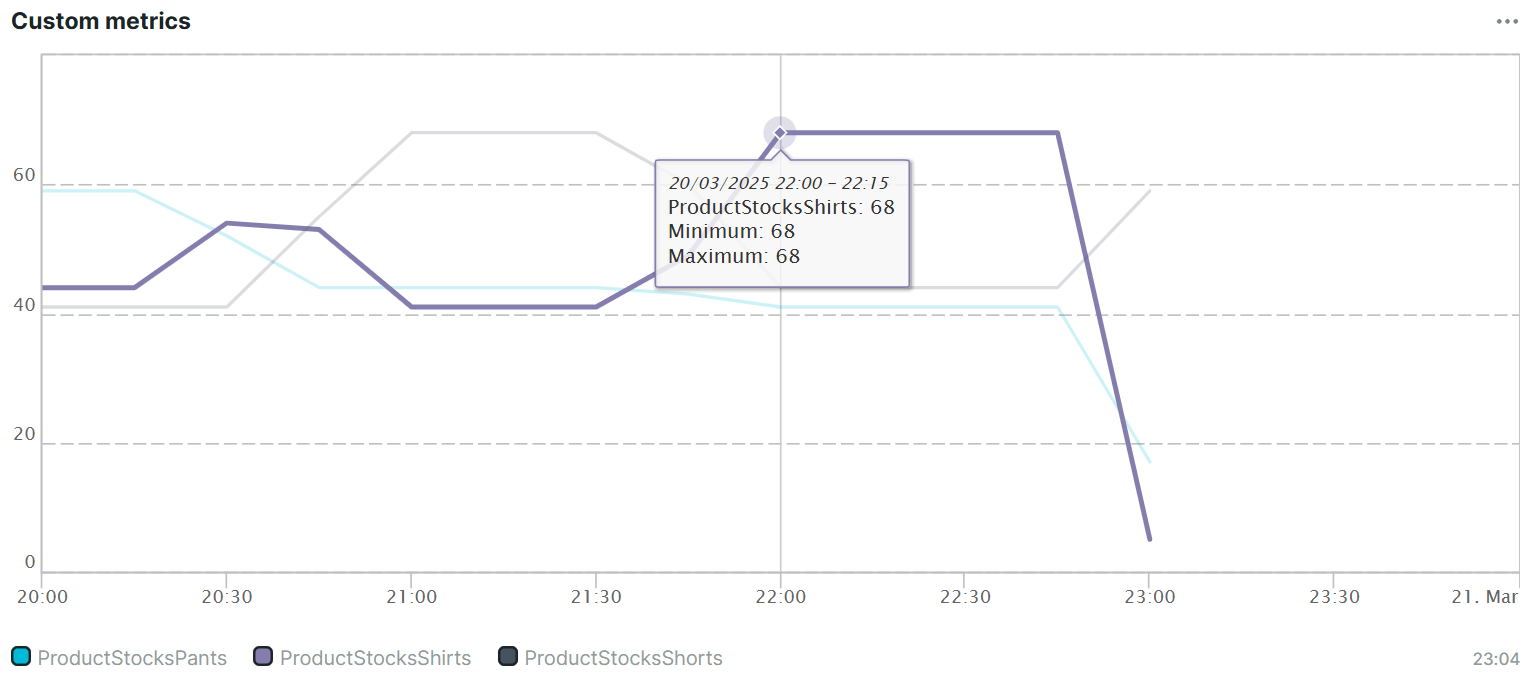
Every time the MSA monitor runs, it continuously tracks the values of the variables. From there, you can create a Custom metrics list or chart for further data or trend analysis, or to monitor your business reports and operational performance:
There are also various ways to use custom metrics in different contexts:
- For DevOps, you can easily monitor the health of your system or application by tracking metrics such as the number of errors logged, concurrent users, and network speed.
- For IT operations, you can monitor data center environment metrics like temperature, humidity, and system health.
- For IT support, you can track the number of support calls waiting on hold, the number of tickets, and SLA performance.
Set up Custom metrics
Once you’ve set up an MSA monitor with a single or multi-step definition, you can set up Custom metrics in two ways: Set using a variable or Set using scripting.
Note that when creating a new custom metric, use a metric name that is easy to read and provides context for its function. The metrics names and monitor names will appear in the list of available custom metrics once they are added to your Custom API data report. Therefore, you can use the same custom metric names to represent similar types of data belonging to different groups. For example, a custom metric called totalSum might be used in both product-related APIs and customer-related APIs. Although the name is the same, the data it represents are from different groups. Uptrends recommends giving the correct names right away. Renaming a custom metric later will be treated as creating a new and different metric.
Set using a variable
This method lets you track and store API response data without the need to write any code or script. You can simply define an expression in a variable and set a custom metric name to use that variable as a custom metric.
Let’s set up Custom metrics using the
Carbon API as an example. We will track the Carbon intensity data using the variable method.
Click the Try it now button to start the demo below.
Set using scripting
This method lets you write your own scripts, giving you full control over how you capture and handle API response data.
Ensure that you use the Custom metric snippets and set a custom metric name to use that data as a custom metric.
Let’s set up Custom metrics using the
Carbon API as an example. We will track the Carbon forecast data using the scripting method.
Click the Try it now button to start the demo below.
To know more about snippets and scripting, refer to Multi-step API (MSA) custom scripting.
Inspect the Custom metric data
Once set up, inspect your custom metrics data to ensure that the monitor captures and tracks the data correctly.
To inspect the custom metrics data you’re tracking:
- Go to the .
- Click the Go to dashboard link for the monitor where you created the Custom metric.
- In the Monitor log tile, click anywhere on a row to open the Check details popup.
From the popup, you can view the Custom metrics data retrieved from the monitor check. Notice that the CarbonIntensity value is 85:
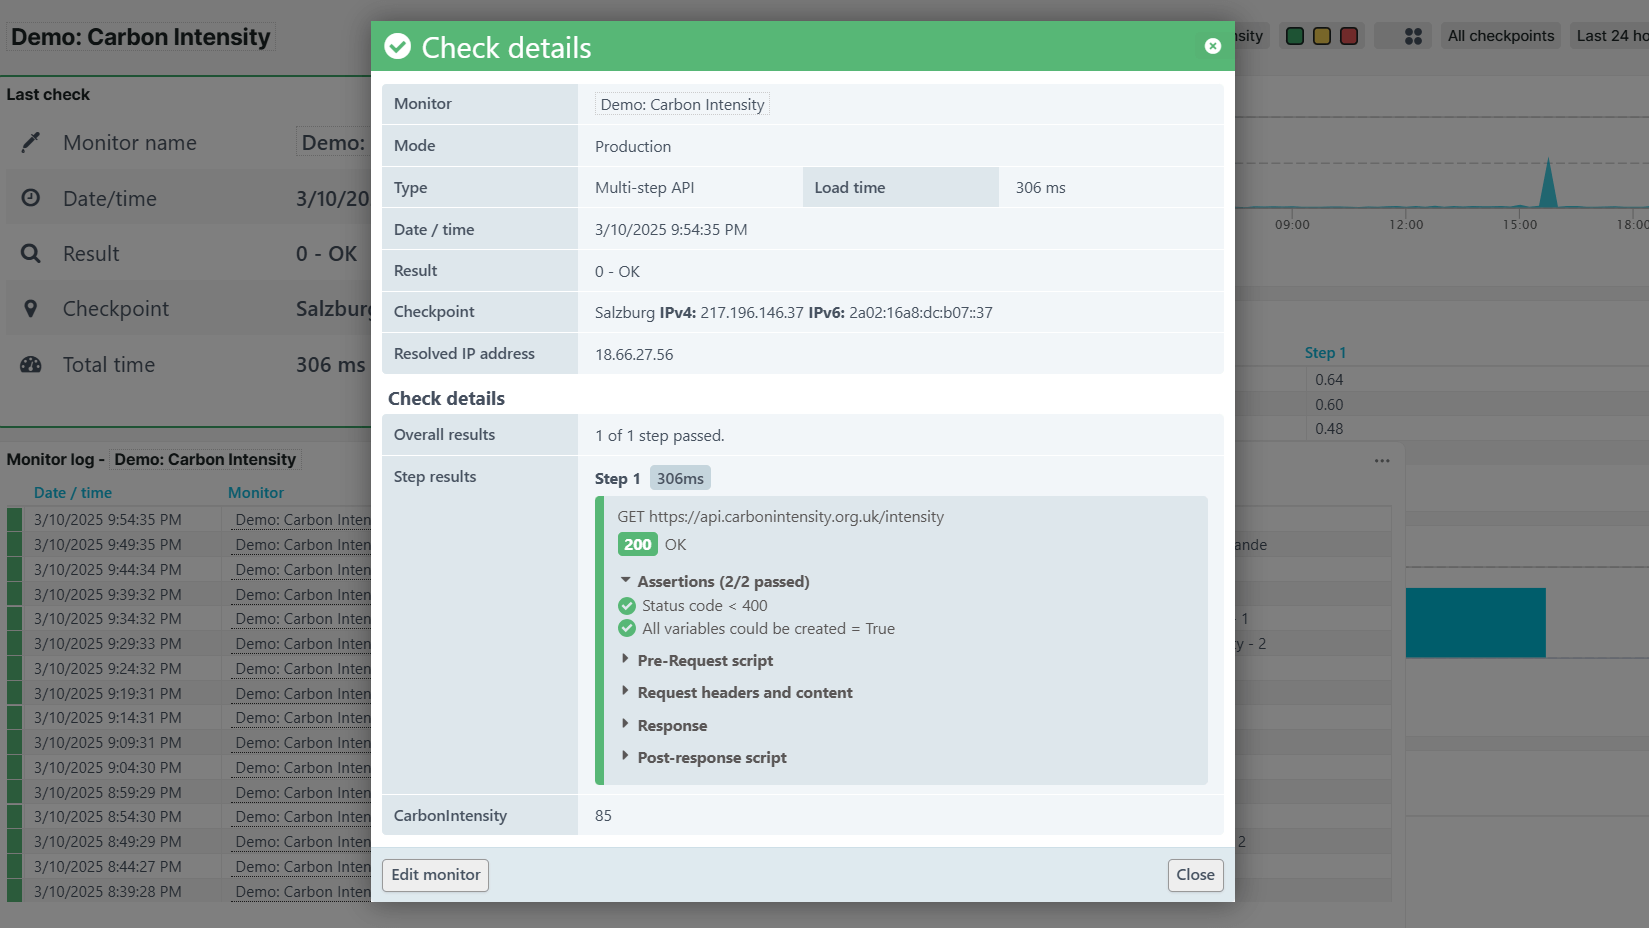
This gives you direct access to the individual custom metric values as they were captured during the execution of the MSA monitor.
Troubleshooting
If you don’t see any custom metrics value, consider the following:
-
Did you accidentally open the check results for an older check that was executed before the new custom metric was defined?
-
Is your Custom metric capturing numeric integer data? If your data contains a floating point number, such as
99.9%or3.1415, use custom scripting to convert them to an integer. If the value contains text data, this won’t be captured. -
If something went wrong during the execution of the MSA monitor, the variable assigned to your custom metric may not have been created. Check for any typos in the custom metric name or variables.
Display custom metrics in dashboards
If you may want to dig deeper and work with the underlying data to precisely detect sudden spike in the values, you can display the custom metrics data in your dashboard using the Custom metrics list or chart:
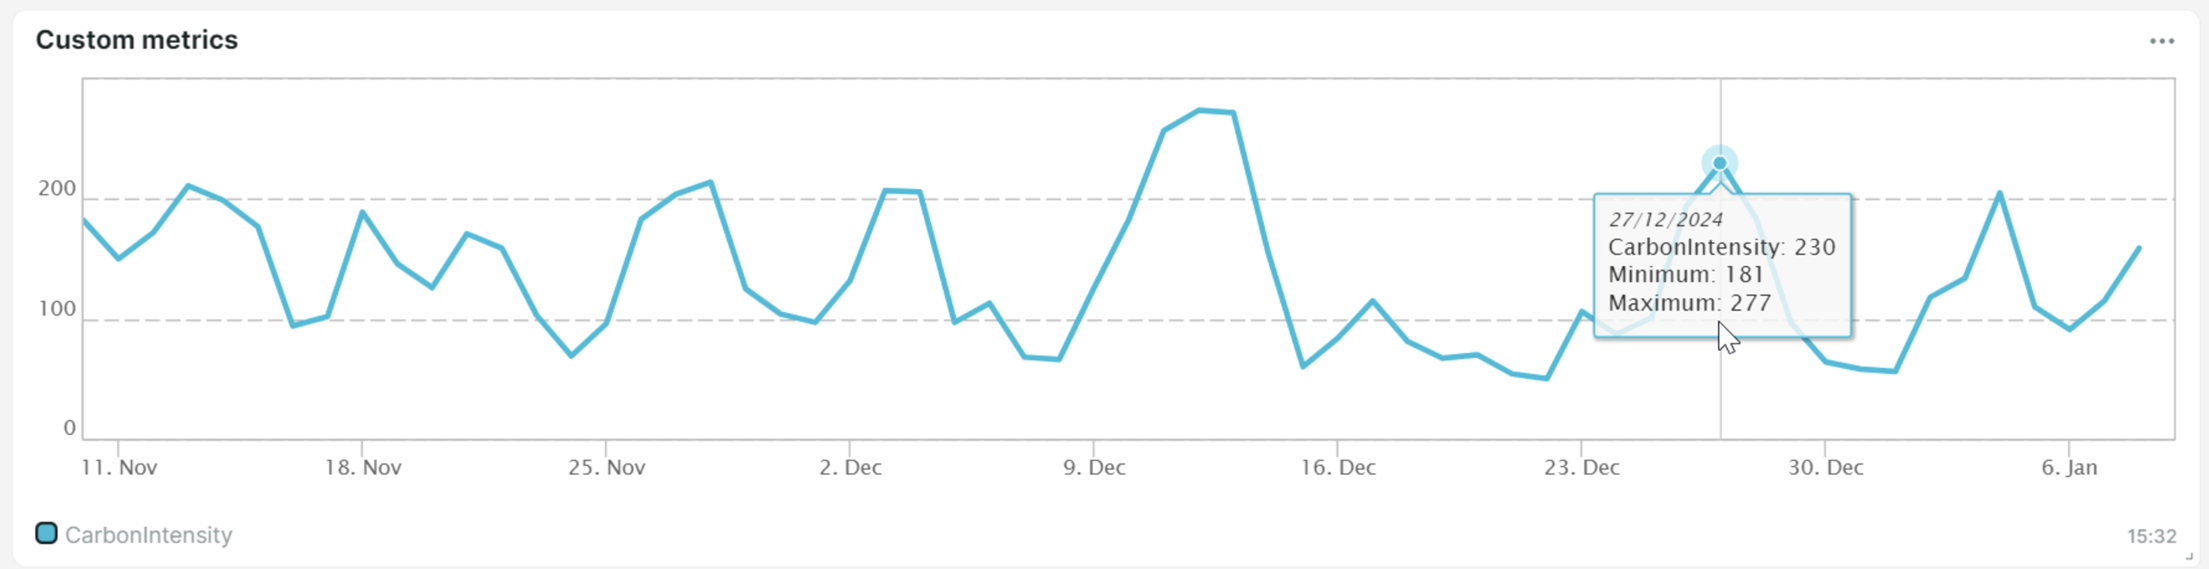
This allows you to see the metric variable’s trend over time, displaying its minimum, average, and maximum values. For more information, refer to Custom metrics list or chart.
You can also export the custom metric list or chart data in different data format through the Exporting dashboard data feature.