
Uptrends offers the Postman API monitor, allowing you to automatically run your existing Postman workspace collections on the Uptrends checkpoint network. You can easily schedule and execute Postman scripts, test the performance of your APIs, and set everything up just like any other monitor.
With millions of users, Postman is a standard industry tool developers use to write, document, and perform API tests. With this tool, you can test HTTP methods (GET, POST, PUT, DELETE, PATCH), add headers, parameters, variables, and many more. You can also group and organize multiple requests, called Postman collections, for later use or share them with others. Simply go to Postman, and you can now run your API scripts with a push of a button every time you need to test your APIs.
With Uptrends, you don’t need to go to Postman to test your scripts, your Postman API monitor does the work for you. This monitor takes your Postman collection of API scripts, including pre- and post-request scripts, imports them using an API URL or from a JSON file, then starts running them across the globe similar to other monitor types.
Benefits of using Postman API monitor
If your organization is already using Postman, use this monitor to your advantage with these benefits in mind:
-
Automatic execution of your scripts: Import your Postman collection and execute it every minute, 5 minutes, hour, and anywhere in the world instead of having to run it manually. We have more than 200 monitoring checkpoints you can select and test with. Additionally, if your collection uses variables like
{{VariableName}}in any requests, scripts, or environments, the monitor automatically detects and creates these as predefined variables for you. You’ll see that these variables are listed in the Variables section of the monitor editor and you only need to populate their value. For more information, refer to Postman API variables. -
No startup time: Just by importing your available and existing scripts in Uptrends, you can get this monitor up and running. There is no need to convert those scripts into a special Uptrends flavor or make any other adjustments.
-
Nothing new to learn: With your background in Postman, you’ll find it easy to use this monitor. Just point us to your Postman scripts and we will get you the results in no time.
-
No changes in your current workflow: You can just continue maintaining your scripts in Postman. Keep in mind that whenever you make changes in your collection, simply retrieve it again in Uptrends and you’re up to date.
Set up a Postman API monitor
There are two ways to set up a Postman API monitor: Import Postman scripts from a JSON file or Import Postman scripts using an API URL.
Import from a JSON file
This option allows you to simultaneously back up your Postman files and import changes from Postman to Uptrends.
To set up a monitor using a JSON file import:
-
Go to menu.
-
Select the Postman API option.
-
Configure your monitor settings based on your monitoring needs.
-
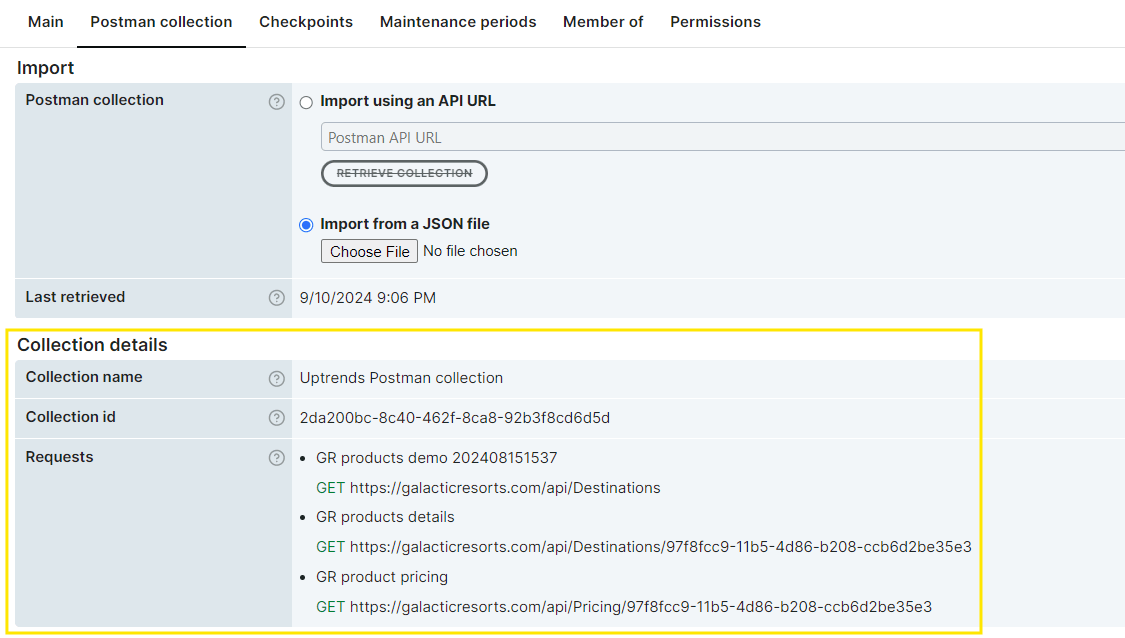
In the Postman collection tab, select the
Import from a JSON file option. To export your JSON file from Postman, refer to Export collections from Postman. -
Click the Choose File button and import your JSON file.
Once imported, the Collection details section will be auto-populated with the same information shown in Postman. Details such as the Collection name, ID, and requests will now be visible.
If your collection uses variables like {{VariableName}} in any requests, scripts, or environments, the monitor automatically detects and creates these as predefined variables for you. To learn more, refer to
Postman API variables.
- Click to confirm the monitor changes.
You’re all set with your monitor. Use the Test now button in your monitor editor to test and view the monitor results.
Import using an API URL
This option allows you to import changes from Postman to Uptrends using an API URL, which is useful for live testing. With just one click, it updates your collection and saves memory space.
To set up a monitor using the Postman collection API URL:
-
Go to menu.
-
Select the Postman API option.
-
Configure your monitor settings based on your monitoring needs.
-
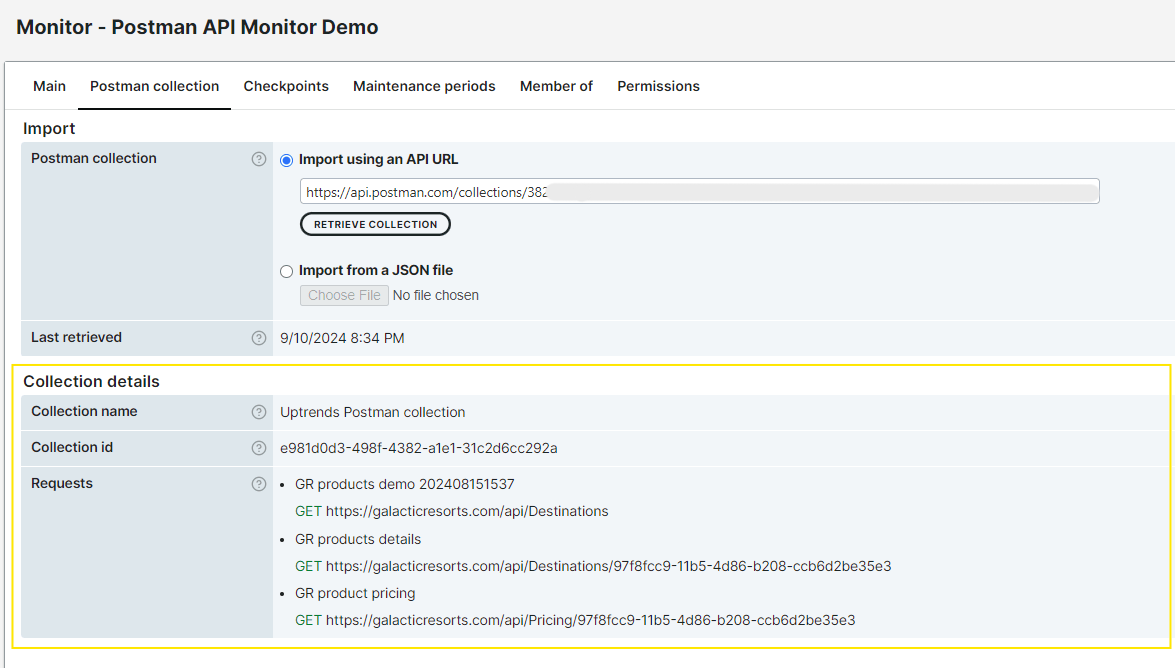
In the Postman collection tab, select
Import using an API URL option. -
Paste the Postman API URL in the blank text field. To get the Postman API URL, refer to Share using the Postman API.
-
Click the RETRIEVE COLLECTION button to fetch the data from your URL.
Once successful, the Collection details section will be auto-populated with the same information shown in Postman. Details such as the Collection name, ID, and requests will now be visible.
If your collection uses variables like {{VariableName}} in any requests, scripts, or environments, the monitor automatically detects and creates these as predefined variables for you. To learn more, refer to
Postman API variables.
- Click to confirm the monitor changes.
You’re all set with your monitor. Use the Test now button in your monitor editor to test and view the monitor results.
For more information, refer to the Postman documentation.
Monitor results
The Postman API monitor test results looks very similar to the Multi-step API monitoring results. In the Check details section, each step mirrors each request contained in the Postman collection with specific items shown below:
- Step duration: the time in milliseconds of how long a step runs
- Step assertions: the actual test results based on your pre-request and post-response scripts parallel to Postman test results. You can see the total count of passed and failed assertions wherein passed results are marked as green checkmarks, while failed results are marked as red cross-mark icon.
- We also show other details such as Request headers, request content and response headers in the same manner as it is in Postman. For example, Cache-control, Content-Length, Server, Date, and others.
Credits
Just like Multi-step API monitors, the Postman API monitor uses API credits. Each request contained in the collection you import uses one credit.