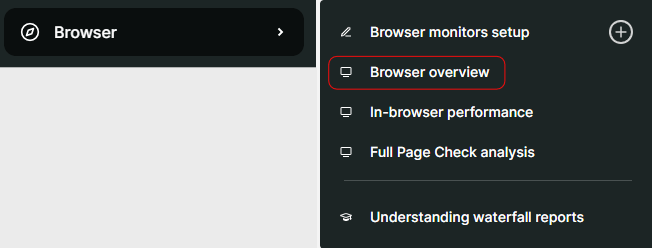
Two new items have been added to the menu: the Browser overview and Uptime overview. These links will bring you to a performance dashboard showing metrics for the browser or uptime monitor type respectively. As an example, you can find the Browser overview now within the Browser menu:
