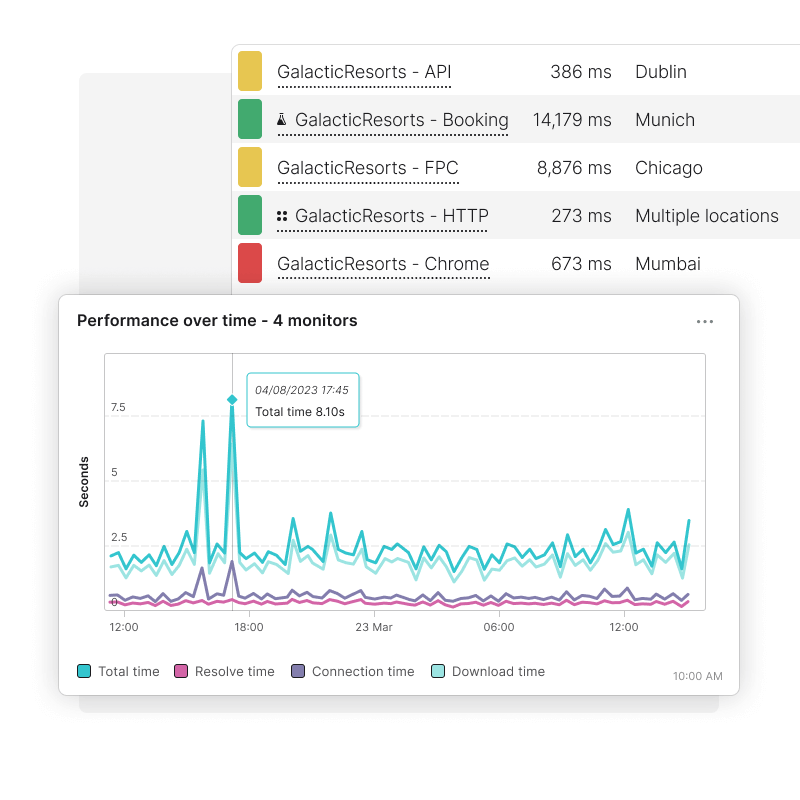
Run web performance tests from 229 locations
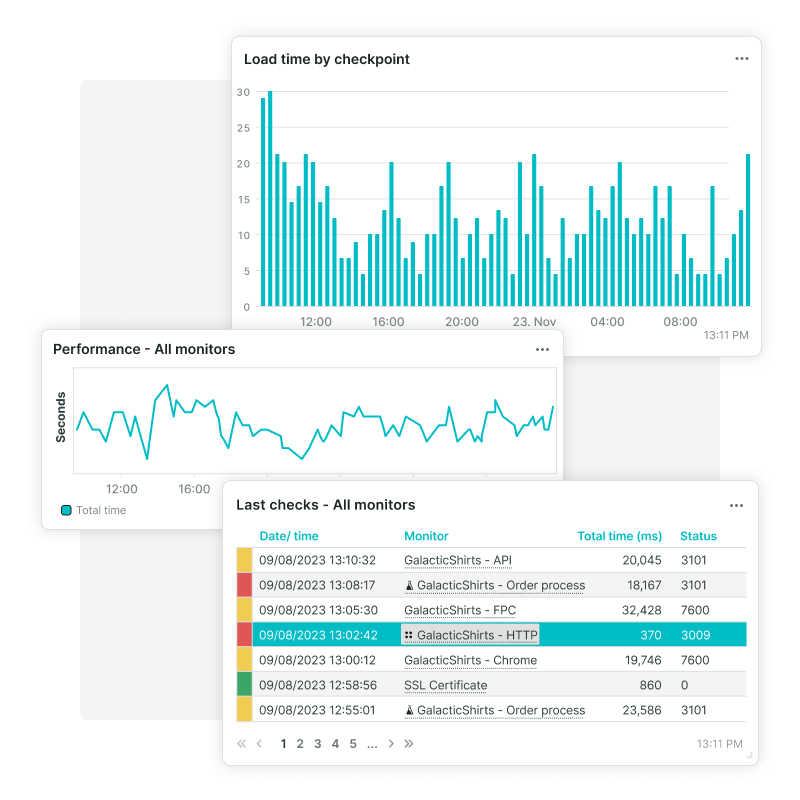
Uptrends opens up a real browser (Chrome or Edge) on one of the worldwide locations you have selected and loads your website with all its elements—exactly like your users see it. You build a detailed picture of your website performance, and you’ll spot peaks in load times immediately.
Build data faster with Concurrent Monitoring. Choose from 3 or more locations, and Uptrends tests from all of them all at the same time. You’ll get a ton more data and quicker alerting.
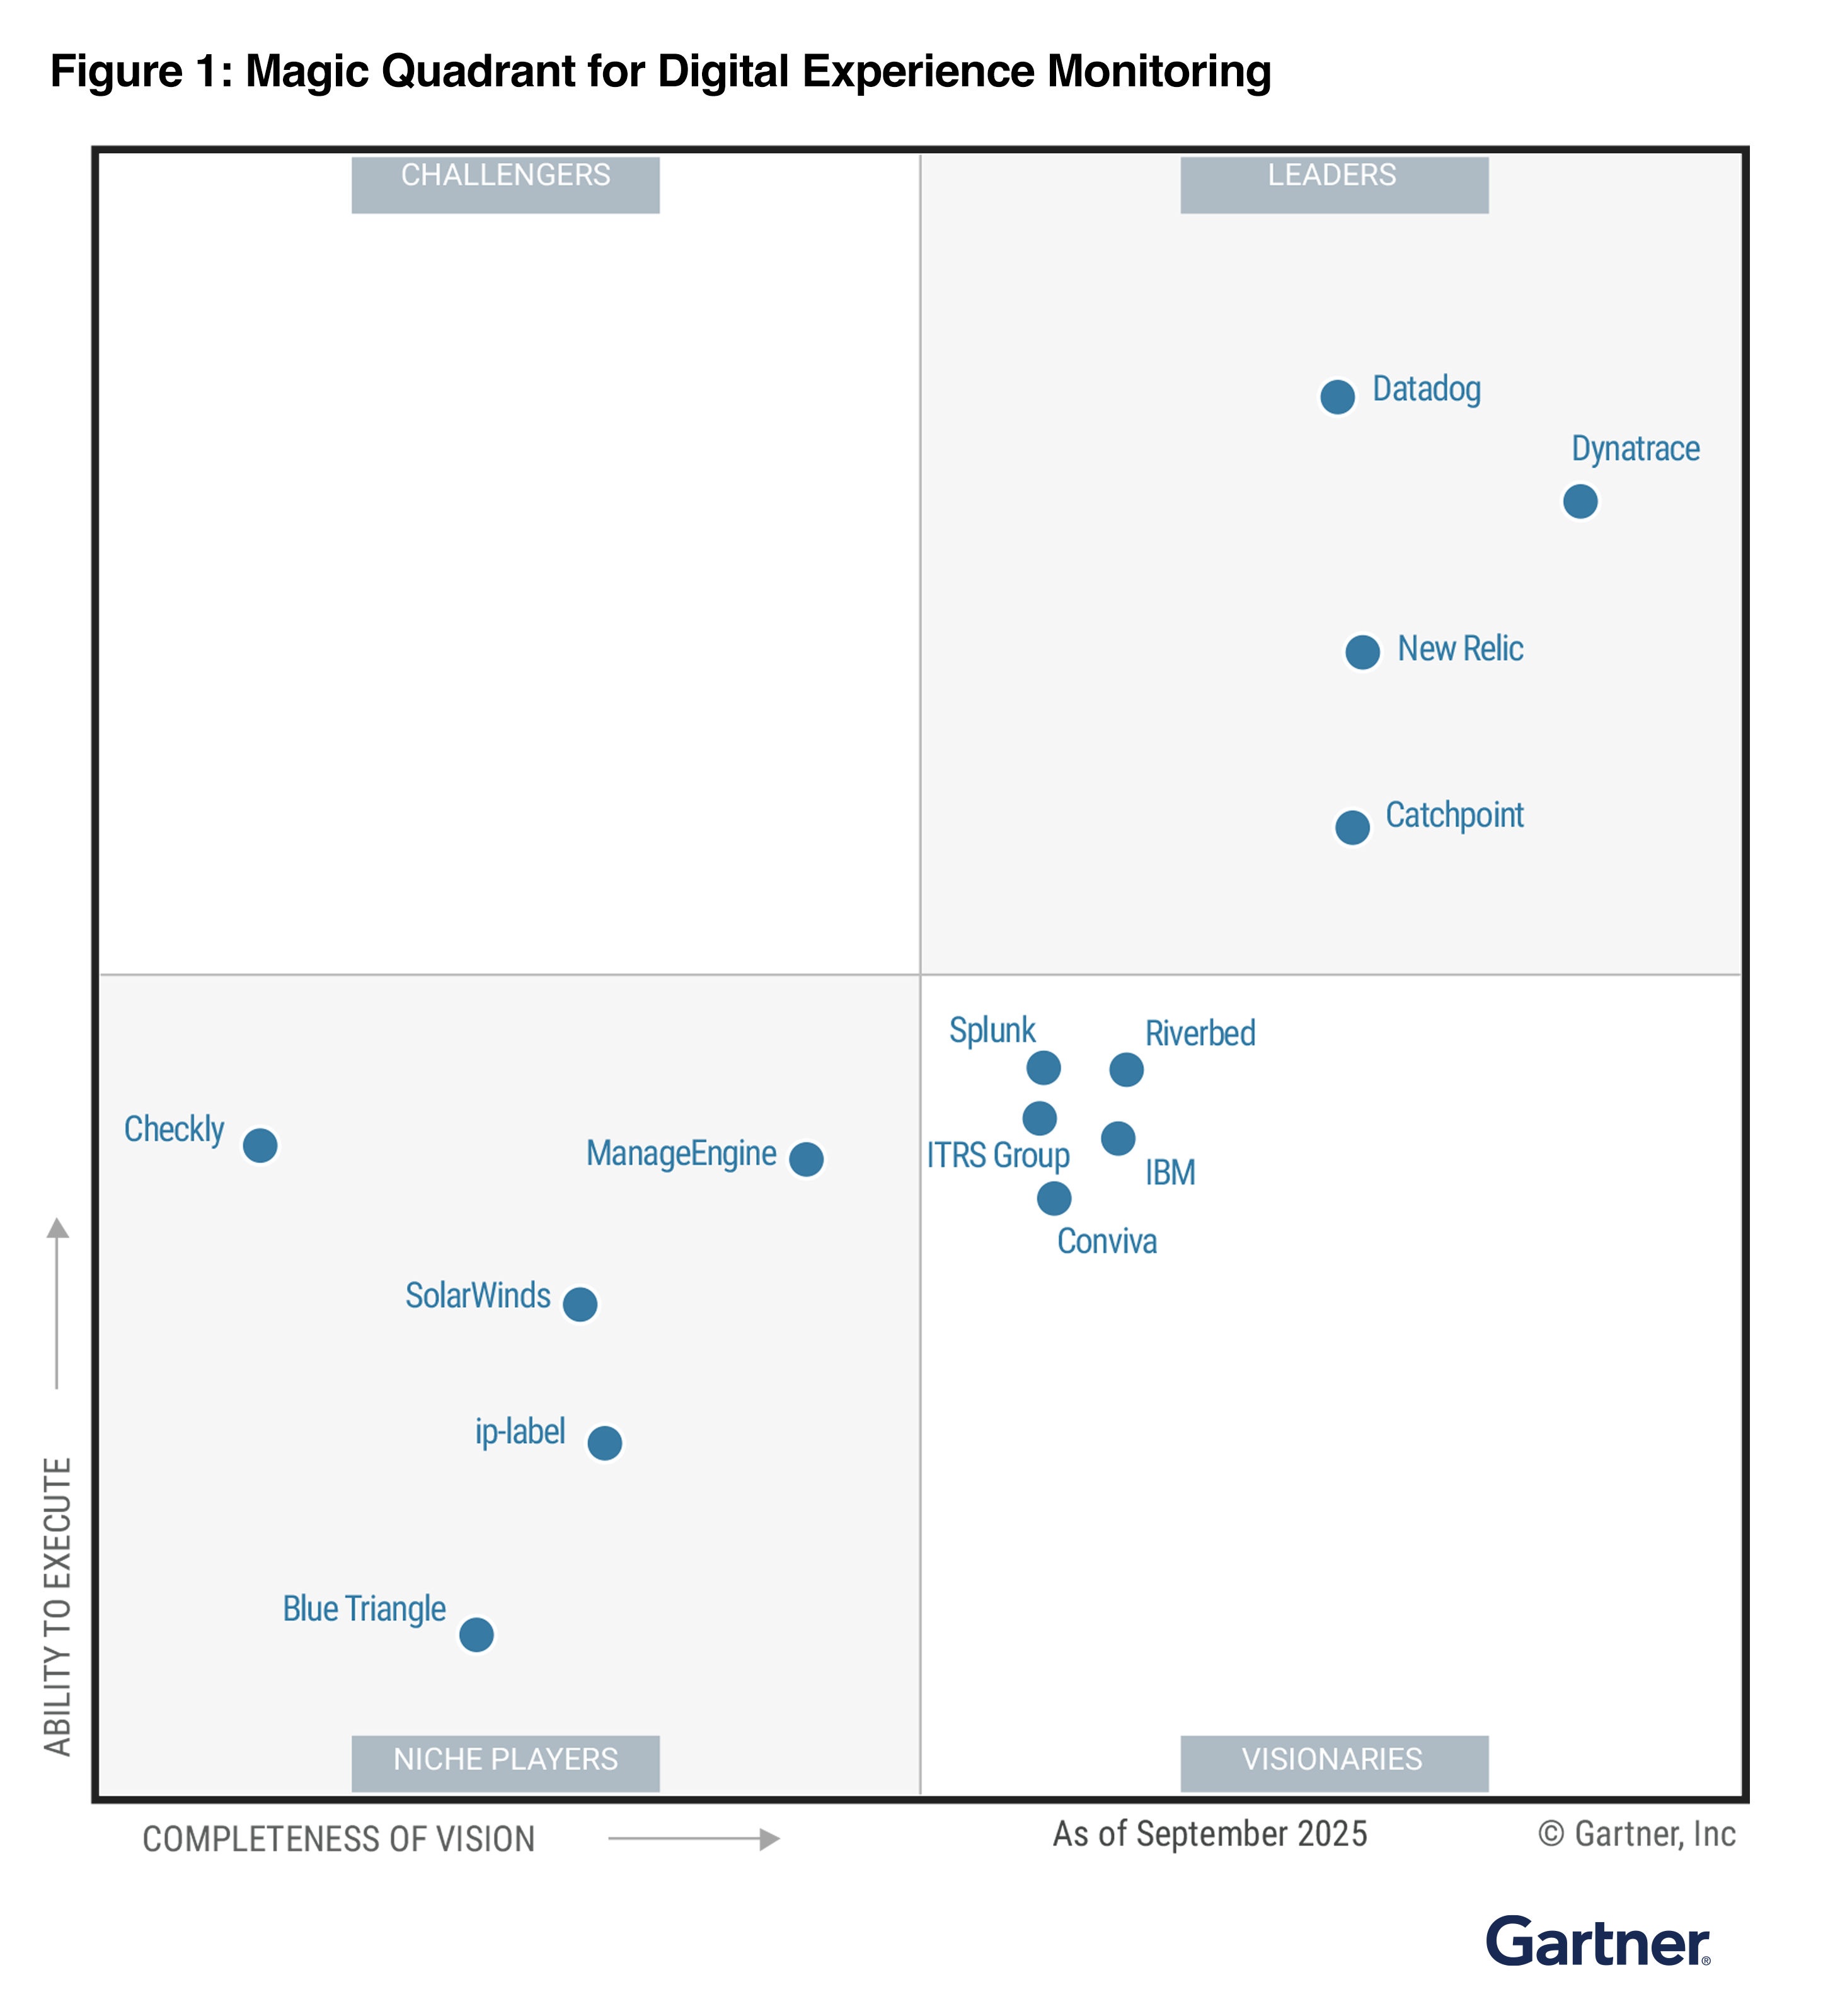
A Visionary in the 2025 Gartner® Magic Quadrant™ for Digital Experience Monitoring
Discover why ITRS has been recognized.
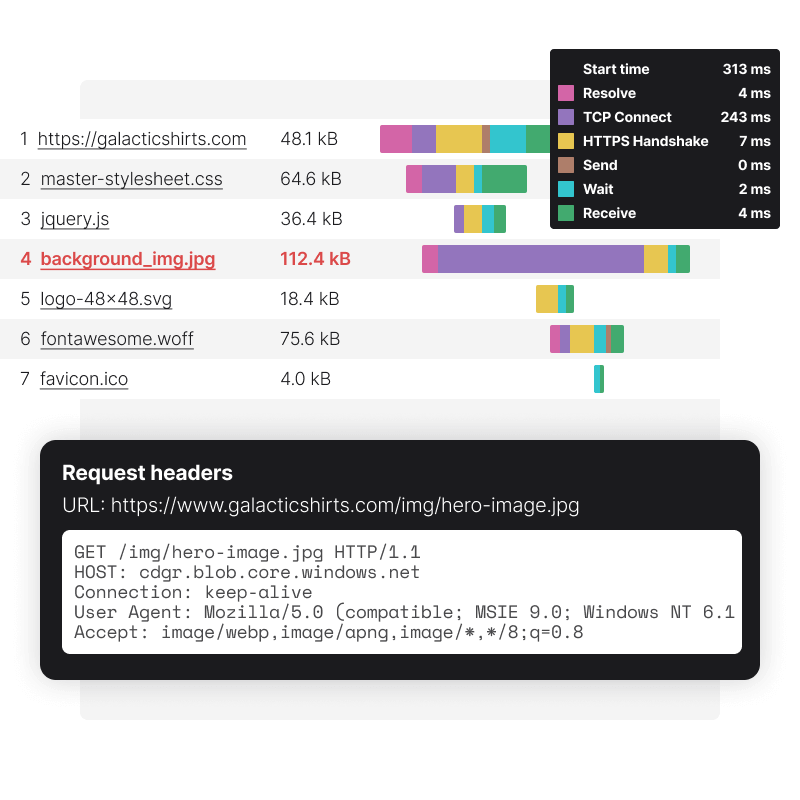
Know exactly what caused the slowdown
Every time Uptrends performs a check, detailed performance data about your page is captured. This gives you a ton of context about how your page is doing—performance-wise.
Waterfall reports help you to identify which element on your page caused the slowdown, so you and your team can act quickly. You see exactly when an element didn’t load successfully or timed out, and how the load time of that element is built up.
You can even dig a little deeper, by inspecting HTTP headers on an element-by-element basis. Is your CDN provider responsible? Now you know.
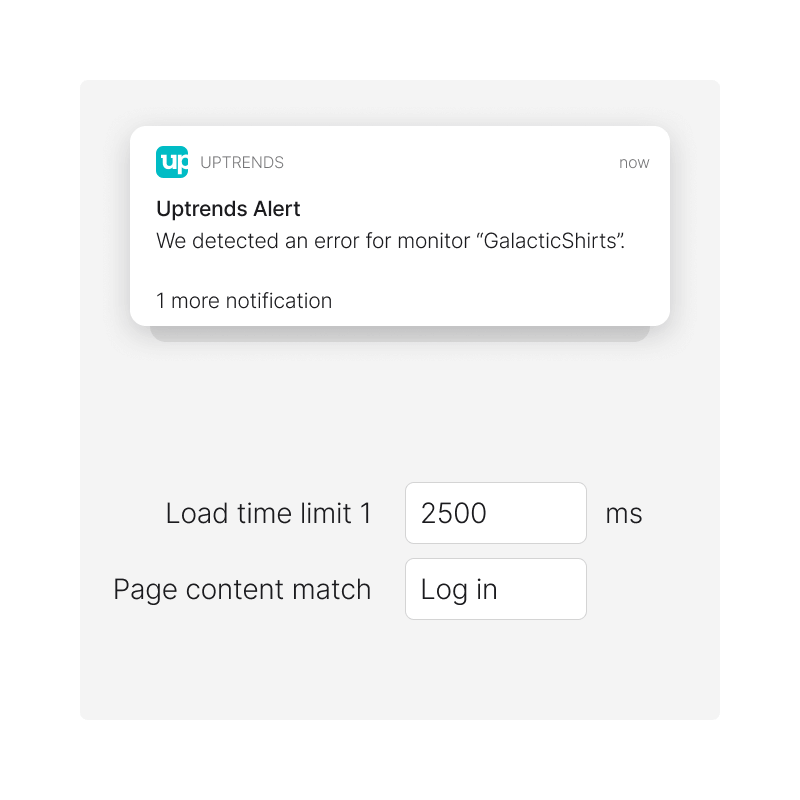
Get alerted on website speed, number of bytes, or missing content
By setting up load-time limits, you get alerts the moment your website speed suffers. If you specify the maximum number of bytes allowed for your page (or individual elements), you know when your site gets hit with the addition of unexpected large content.
If you want to ensure your page content loads as expected, you can use content checks to know when certain content is (or isn’t) there.

“When you can correlate the developers' changes with changes in performance in Uptrends, it makes analyzing the situation easier.”
Optimize web performance in Chrome and Edge
We have Chrome and Edge running on our servers, so that you can compare your Web Performance Monitoring results from different browsers side by side.
More importantly, we make sure our servers always run the latest version of each browser, so you get results that match what your users experience. As obvious as it sounds, it’s not something most monitoring companies do. We wrote a little something about it in this article.
See how your website performs on mobile devices
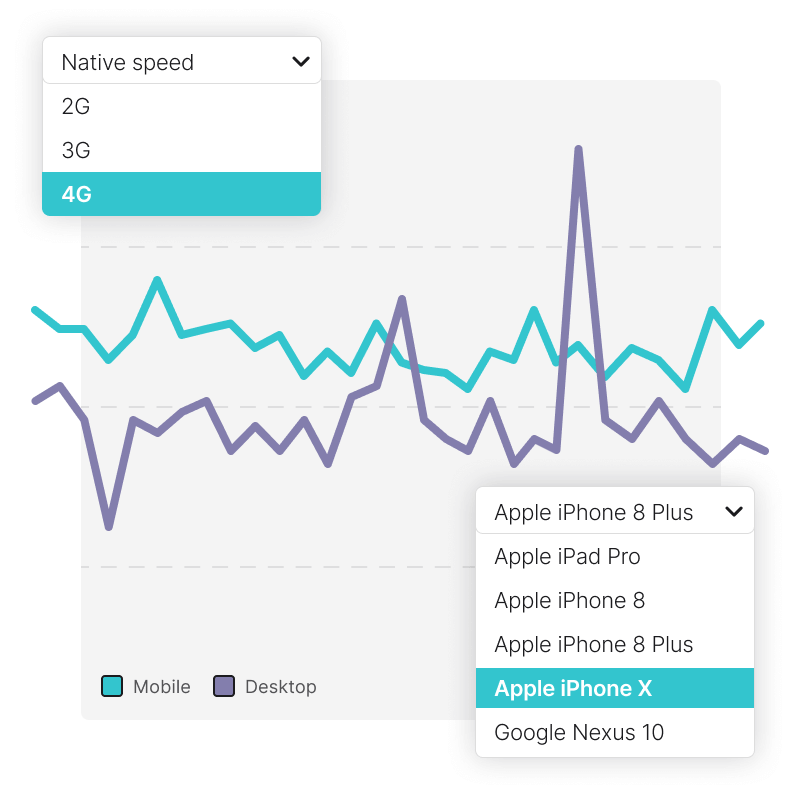
Optimizing your website speed for the desktop doesn’t cut it. With Mobile Website Monitoring, you can simulate a mobile device, choose the screen size and resolution, and activate bandwidth throttling to simulate mobile network speeds like 3G and 4G.
Rank higher
Google has used site speed as a page ranking factor since 2010. But, did you know that Google recently switched to using a site’s mobile speed to determine page rankings? Making sure your website is faster on mobile gives you an edge over the competition for page rankings.
Convert more visitors
Mobile sites that load in 2.4 seconds enjoy a 27 percent increase in conversions rates over sites that load in 3.3 seconds. Study after study supports a direct correlation between performance and conversion rates, cart size, and overall sales.
Fast website = happy users
A one second slowdown is all it takes to turn off users. Slow sites lower a visitor’s perception of your brand and your site’s usability, security, and appearance. A slow site sends 49 percent of its users to the competition, and 33 percent of those never come back.

“We monitor the performance of our home page, and we get quite different performance with different browsers.”
Measure up your site performance to industry benchmarks
Our updated Full Page Check (FPC) monitor type displays crucial loading events of Google’s Core Web Vitals and W3C navigation timing metrics, such as First Contentful Paint (FCP) and Time to first byte (TTFB).
Additionally, we generate screenshots (like a filmstrip) while the page is loading. With a visual timeline of these screenshots, you can see exactly how long it took for your page to load.

Maintain control over your third-party content
Most likely, you load scripts from third parties on your site such as your Google Analytics script or that live chat script you have running. That’s all stuff you have less influence on.
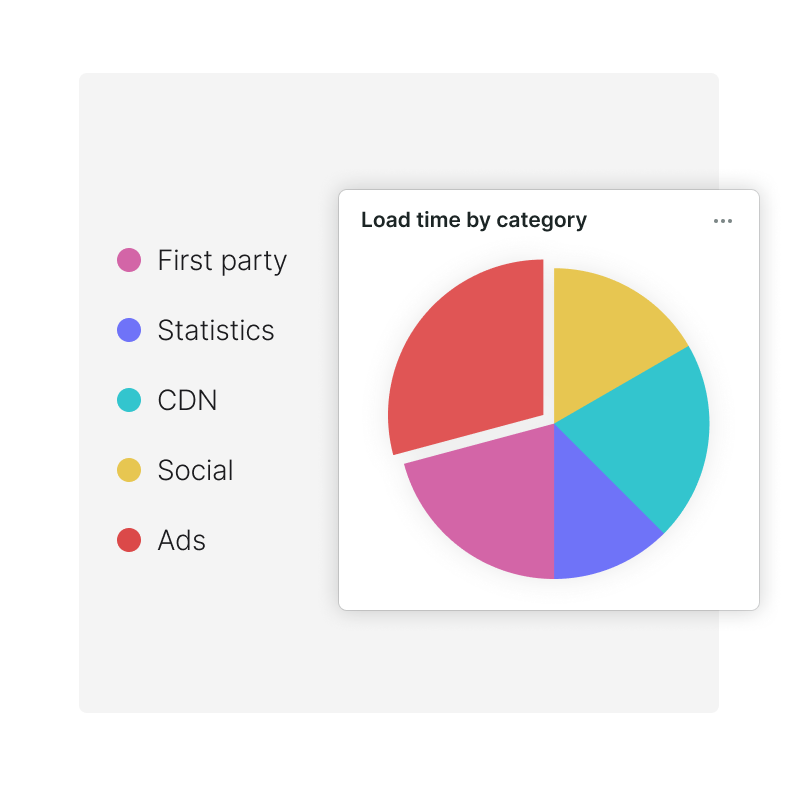
Group your page’s elements into categories like statistics, CDN, social, and ads, or create your own groups. When, for example, your ads get out of control, you can pinpoint the problem immediately in your reports.
Ready to start improving your website speed?
Don’t let your page performance hold you back. Website performance monitoring can help you improve customer satisfaction and conversion rates. Try Uptrends free for 30 days, without obligations.
Let’s get startedQuick take-aways in PDF format?