Real Browser Monitoring
The real thing: No simulations, but real browsers
You can choose from two different browsers to monitor your website in. We spin everything from an authentic bowser, so you’re getting authentic results. No simulations here!
Google Chrome
About 60% of internet users worldwide use Google Chrome.
Optimize for all screen sizes
Edge
For many Edge is their default web browser. For the best compatibility make sure that your site loads quickly and cleanly in the latest versions of Edge.
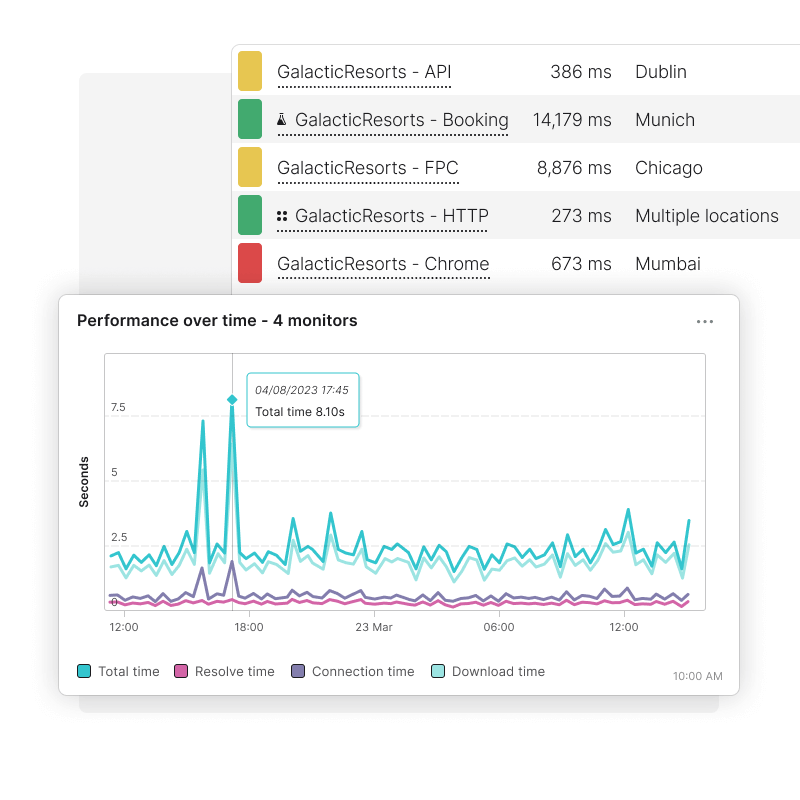
Show the results for different browsers side-by-side
Compare how your website performs in different browsers by setting up a monitor for each one. Check out if your website is optimized for Chrome or Edge with just a few easy clicks. Create a dashboard and incorporate data for different browsers to quickly compare your website’s performance across all of these browsers instantly.
Analysis
Detailed waterfall charts to prove your points
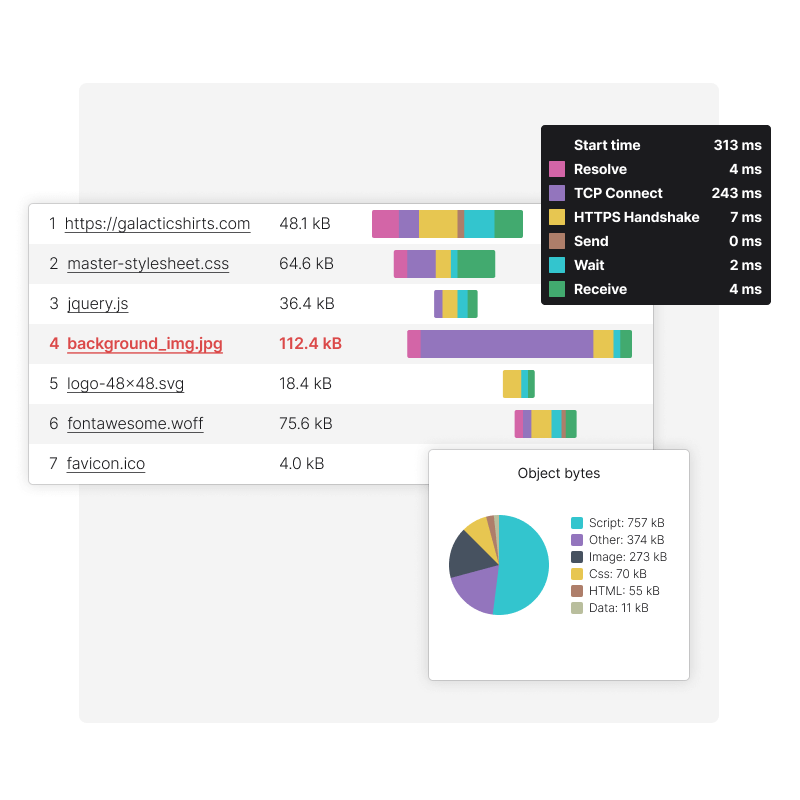
Detailed waterfall charts help you to understand why your site is slow. View page load times, element sizes, and http headers for individual assets in a web page.
Catch all website elements
A webpage could generate hundreds or even thousands of pieces of data. Inspect every single one with a waterfall chart.
Are scripts slowing down my site?
Third party scripts and other elements could be slowing you down. Get a detailed look of each element’s load time to see where the problems are.
Drill into your site’s conditions at any given time
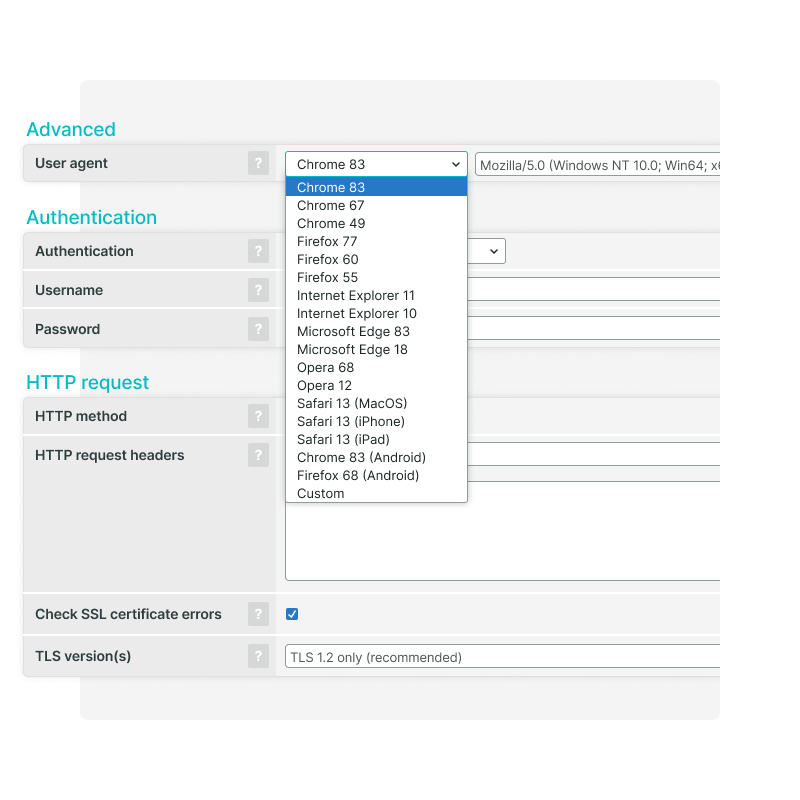
Look at the cookies, user agent, and other information that the browser was showing when an error occurred.
Stay in control over site elements
Are you aware how many different things your website is trying to load at once? Stay in control over your site elements, by monitoring the maximum number of bytes your site downloads.
Get an in-depth view into your browser-side web application
Achieve a clearer picture of the problems that are affecting your users by seeing exactly what happens in the browser, just as your users do.
The full package
Experience the power of Uptrends Website Monitoring
Gather website metrics across different browsers in about every major city throughout the world. Pinpoint errors and analyze load times in your customized Uptrends environment.
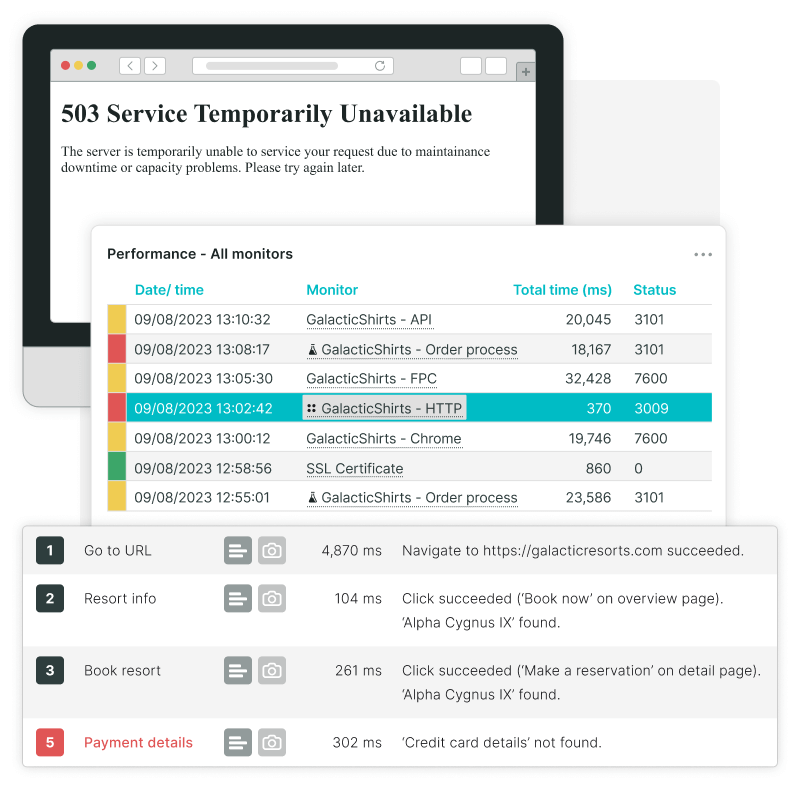
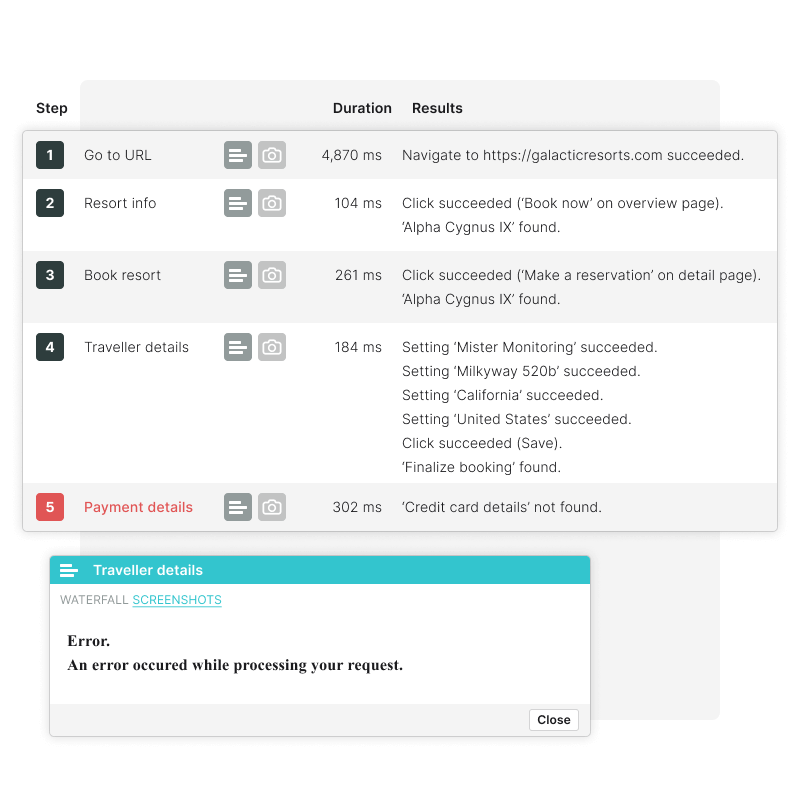
See what goes wrong with error screenshots
When we detect an error we’ll send a detailed screenshot so you can see exactly what the browser was spinning when the problem occurred.
View browser performance from 233 locations
Your users are all over the world, so you need to be too. Monitor your website from our network of checkpoints on 6 continents.

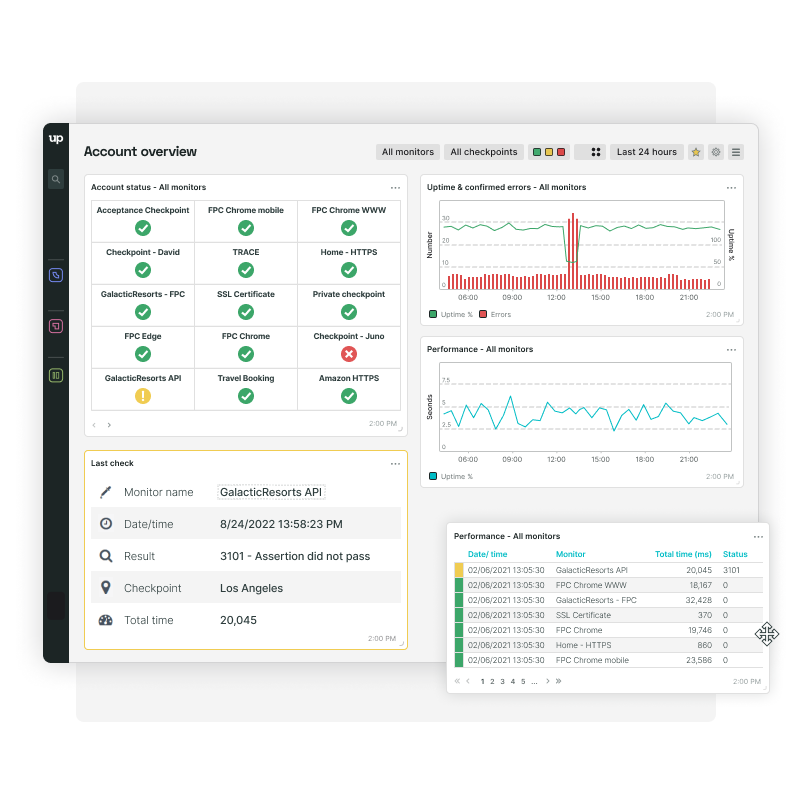
Custom dashboards
Take advantage of our easy to use dashboard interface for custom graphs and charts for multiple monitors, allowing you to easily compare performance.
Ready to start testing your site in multiple browsers?
See how your website performs in different browsers with our 30 day free trial. Try us today!
Try Uptrends For Free