The Custom metrics in Multi-step API monitors (MSA) let you create custom metric variables to collect and store numerical data from an API response step.
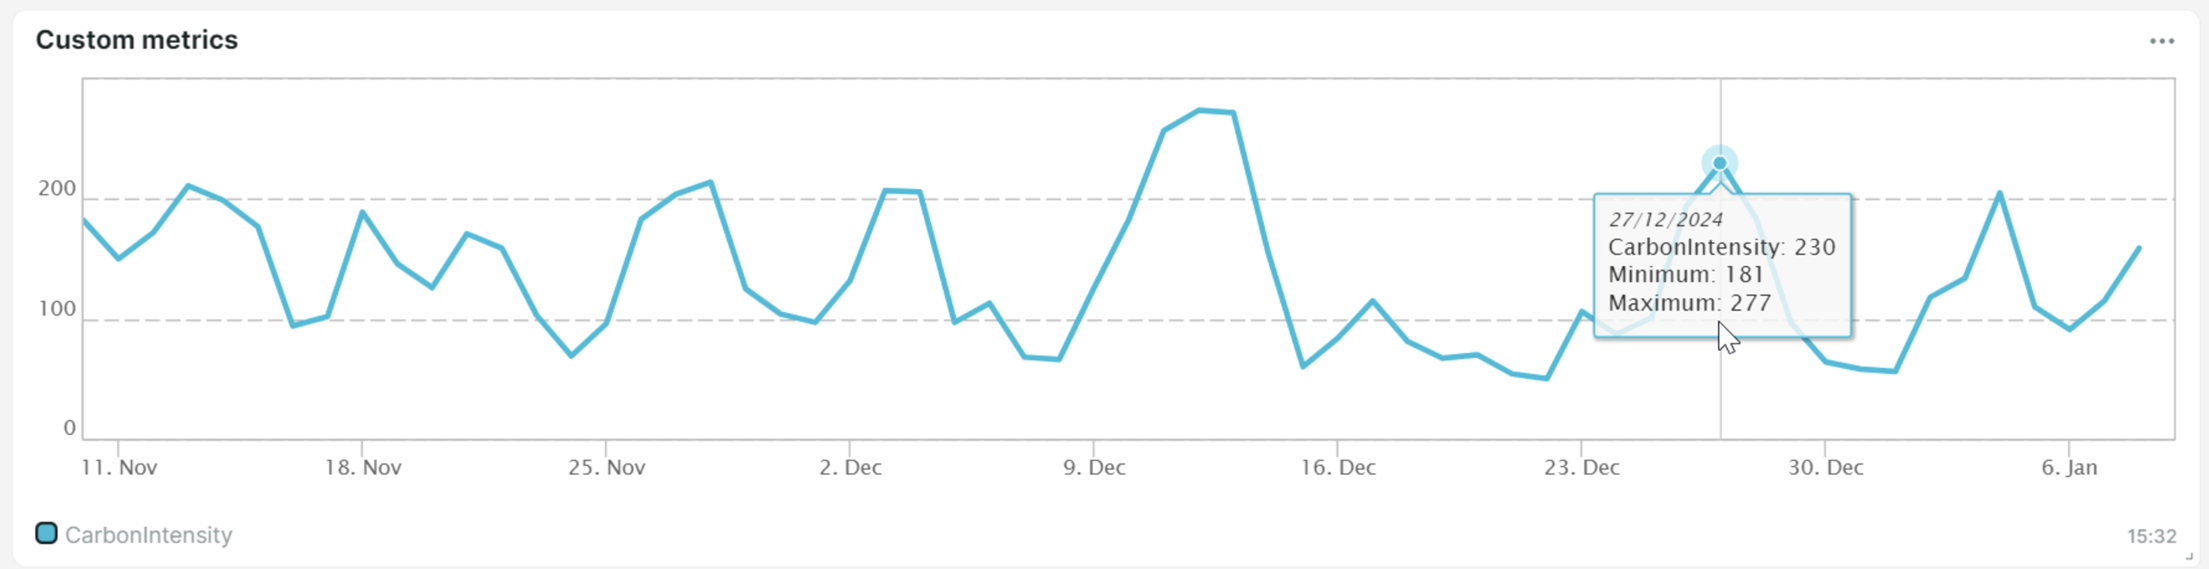
These metric variables can be displayed through a Custom metrics chart , showing the metric’s trends over time. Before, the chart only shows the custom metric’s average value (high points) as a data point. Now, the custom metric’s minimum and maximum values are also displayed. Note that existing MSA monitors with custom metrics data from 1 November 2024 onward will be reflected in your Custom metrics chart.