
What does the switch mean for Dynatrace’s Synthetic Classic monitoring users?
Dynatrace calls it an “upgrade,” but is it really?
Your users aren’t in the cloud
Dynatrace monitors from the cloud, not the worldwide network of data centers Synthetic Classic uses/used. Testing from the cloud doesn’t accurately reflect real-world user experiences. Your customers use busy, congested networks on devices that are slow to parse and load data, unlike cloud-based supercomputers.
Cloud-based monitoring ignores network latency
Internet connectivity varies worldwide depending on the connection type, infrastructure, and device. Testing from the cloud means you’re really only getting cloud-to-cloud measurements while ignoring much of the world’s much slower routes and networks.
Huge monitoring holes
Cloud providers put their data centers in densely populated areas ignoring many regions of the world. For example, Google’s cloud service doesn’t have any regions in Africa, the Middle East, or Northern Asia, while South America and Australia only get one region each. With cloud monitoring, will you ever know how your users are fairing in remote locations?
RUM can’t make up for the holes
When monitoring for uptime, cloud-based synthetic monitoring may miss regional outages, and Real User Monitoring can’t track uptime. If the user can’t access the site, RUM scripts aren’t loaded, and data is not sent. You won’t know about an outage until those users complain.
The alternative
Uptrends is the full-featured alternative to Dynatrace’s Synthetic Classic
Test for uptime, performance, and function
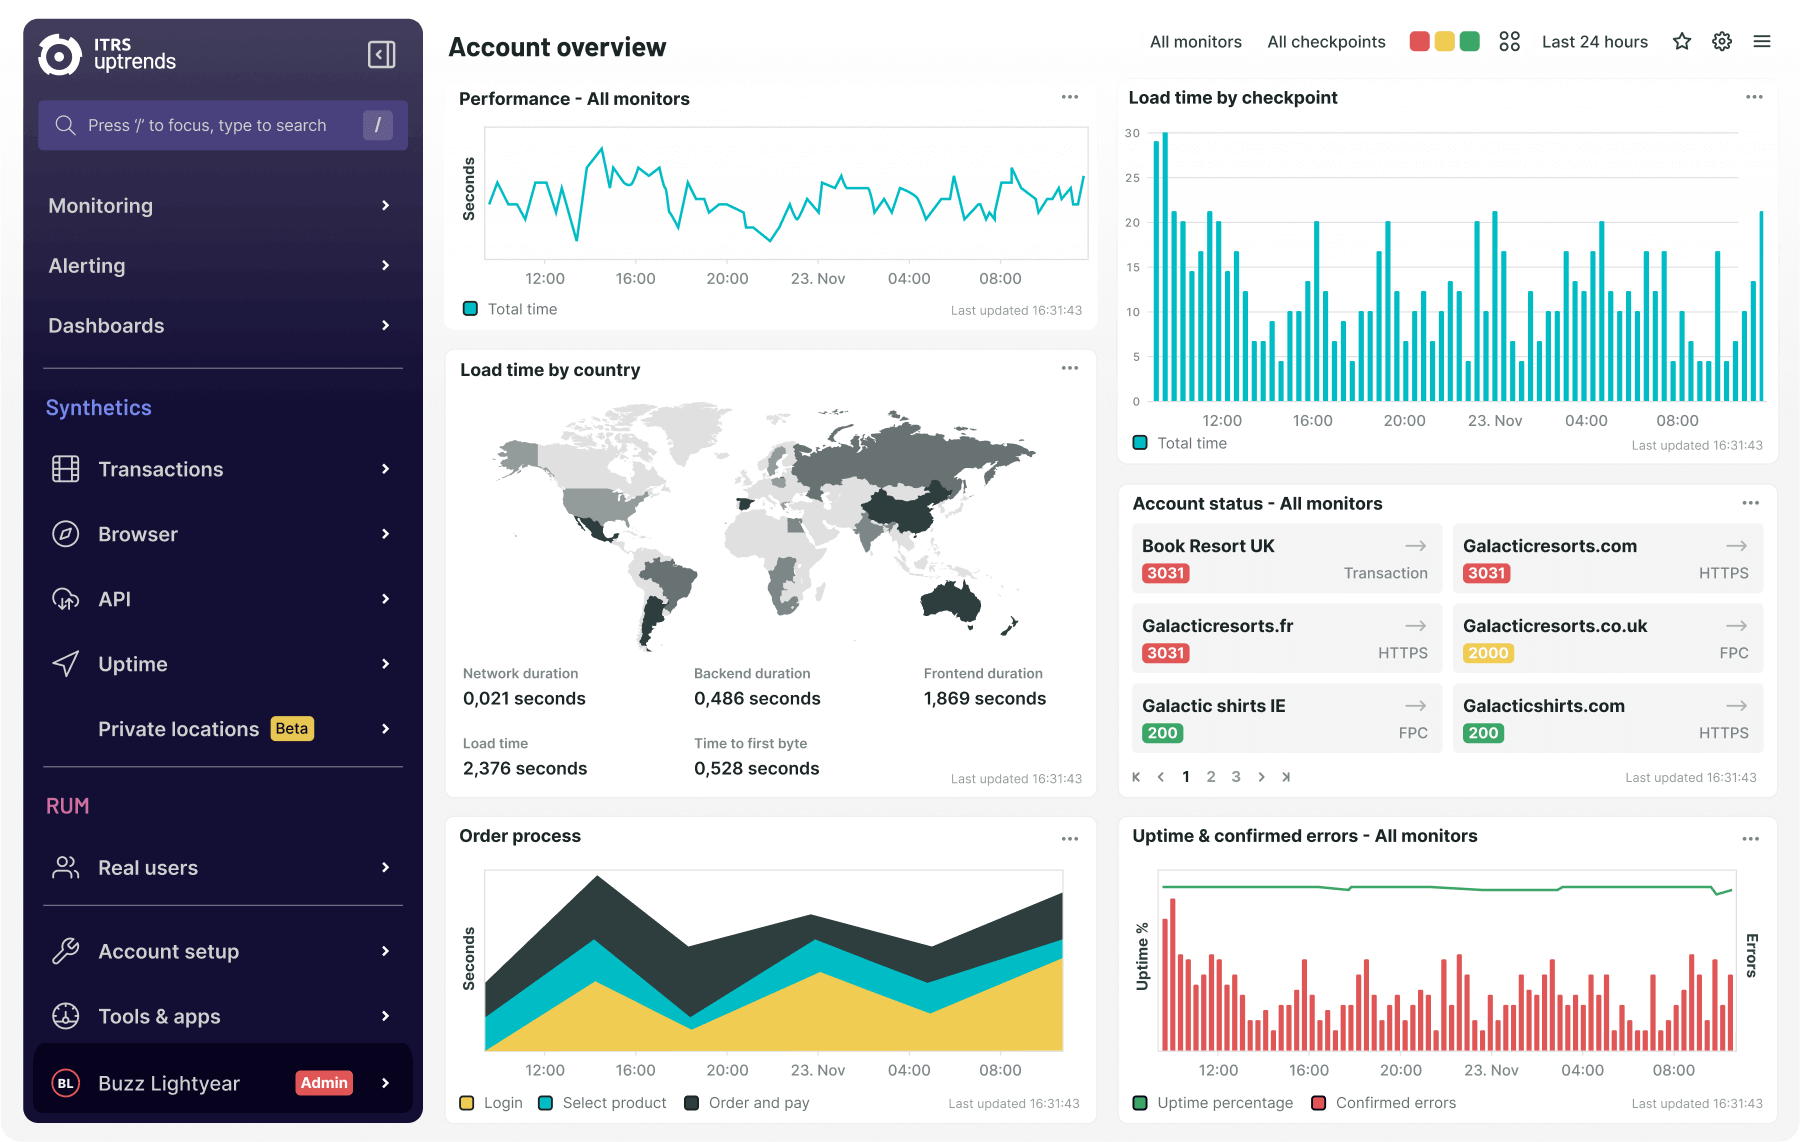
Uptrends has the tools you need to make sure your websites, web services, servers, and APIs stay up, perform well, and work properly.
Large reliable checkpoint network
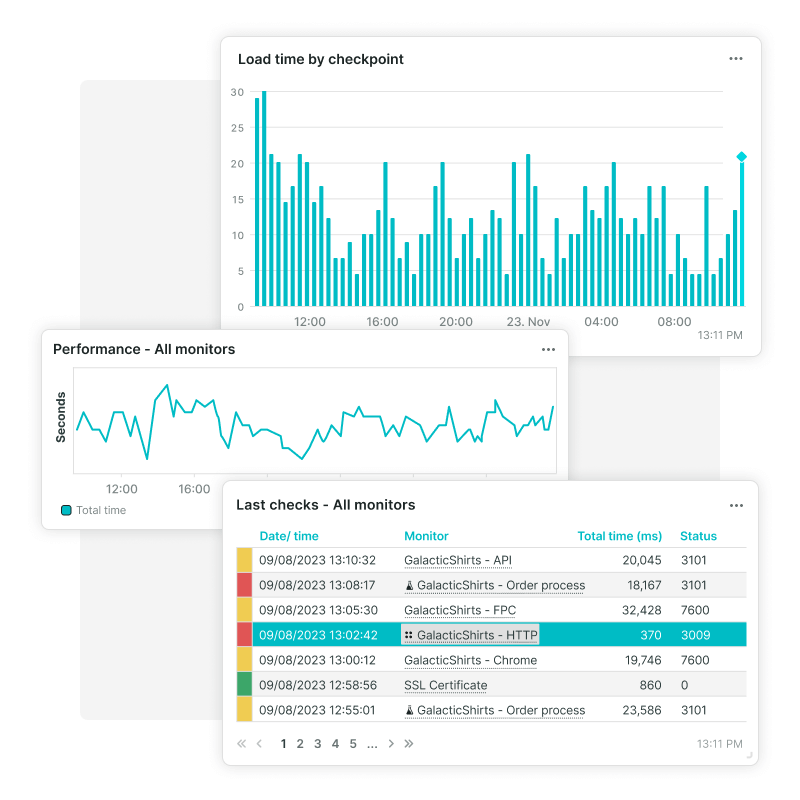
We’ve got over 233 worldwide testing locations . You can test your web assets from your users' locations like you did with Synthetic Classic—not the cloud like Dynatrace.
Solutions you can trust
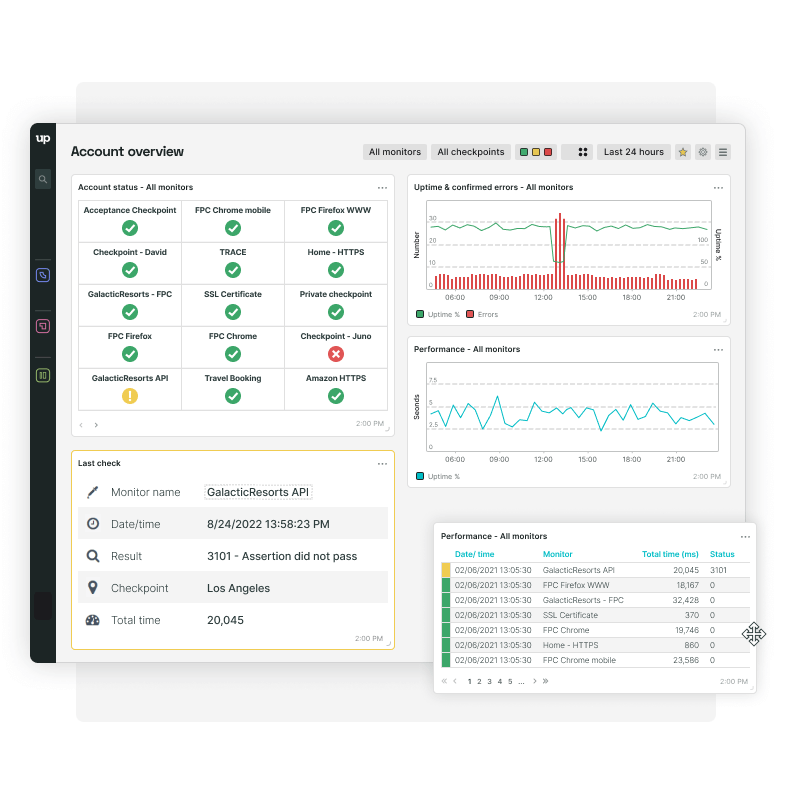
We’ve got synthetic monitoring and Real User Monitoring you can trust to keep your teams informed through a single integrated interface.
Affordable, comprehensive monitoring
We’ve got the packages to fit any need and any budget. If you only need basic uptime, we’ve got a plan for you, and if you need transaction or multi-step API monitoring, we’ve got a plan to accommodate your needs too. All of our paid plans come with error-free alerting, public status pages, intuitive dashboards, and the option to add Real User Monitoring.
Complete synthetic monitoring package
We have the synthetic monitoring you need
Advanced Availability Monitoring
Our Uptime Monitoring tests every minute to make sure your website or service is available, but you can also check the availability of your databases, email, SFTP, or any other Internet-facing server.
Performance Monitoring
Our real-browser Web Performance Monitoring checks your website’s speed element-by-element, and you gain valuable data to help you pinpoint bottlenecks and troublesome third-party content.
Web Application Monitoring
Our Web Application Monitoring tests transactions like shopping carts, logins, bookings, and checkouts for error-free function and stellar performance through the complete user journey.
Multi-step API Monitoring
Multi-step API Monitoring tests your API interactions from start to finish with data reuse and verification. You can test complete API interactions for function and performance.
Features
We’ve got the features you need
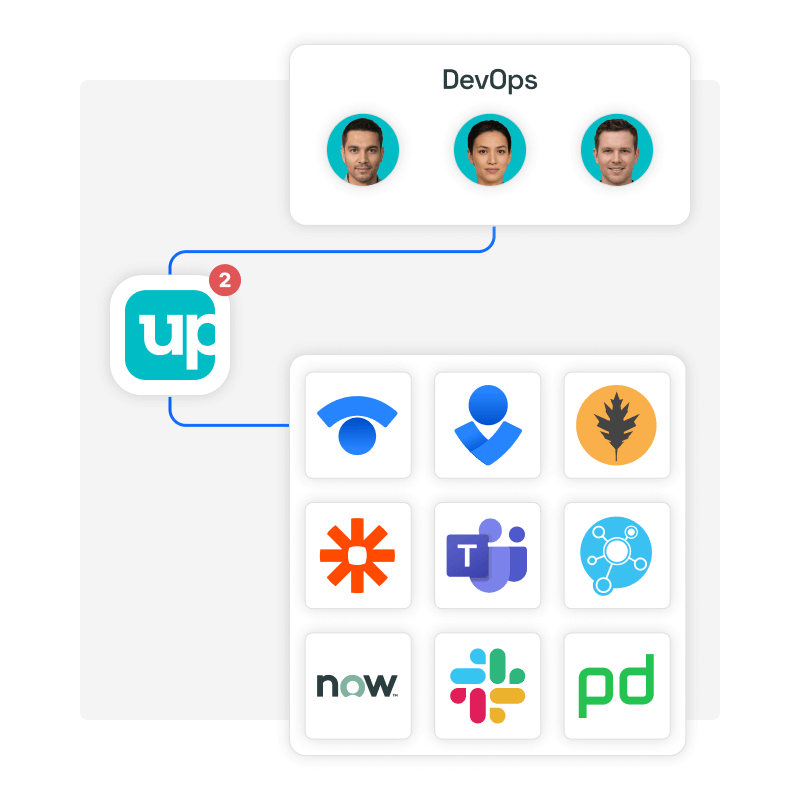
Email and SMS alerting is a great start, but we’ve also got direct integrations with Slack, PagerDuty, StatusHub, ServiceNow, and Splunk On-Call. Also, our automated voice/phone alerts can get your attention when others can’t. Need more? Our webhooks make it easy to integrate with the tools your team uses most.
Huge checkpoint network
The closer you can get to your site’s actual users, the better your synthetic monitoring results. We’ve got 233 worldwide checkpoint locations, and we keep adding more all of the time. Also, if you need to monitor websites and APIs inside your network, we have Private Checkpoints .

Service
We are here to help you transition from Dynatrace
Monitoring consultants
Our monitoring consultants are here to help transition from Dynatrace and help you figure out the monitoring options and the plan that works for you. Schedule your one-on-one demo with your monitoring consultant today!
Support heroes
Our support team is top-notch and ready to help you with your technical monitoring questions, write and test your transaction scripts if you need them to, and address your concerns. Our support team is ready to help you make the switch from Dynatrace, and they’re just a support ticket away.
Detailed documentation
Our Basics will speed you through the monitoring basics, and our Knowledge Base will help you with your tougher questions with detailed examples.
Switch from Dynatrace and give Uptrends a try
Try Uptrends and experience the difference our engaged team of monitoring experts can bring your business. We’re here to help you succeed.
Try Uptrends free for 30 days