Log Management
Log Analytics and Reporting where and when you need it
Collect, search, and correlate detailed logs from websites, applications, APIs, infrastructure, and network devices for faster troubleshooting and investigation with a scalability that is faster, easier, and more attainable for organizations large, small, and everywhere in between.

Timeline screenshot
Unify log data with timeline screenshots directly from your Chrome browser. Visual connections across your web applications and infrastructure to provide meaning to captured log data.
Waterfall charts for debugging
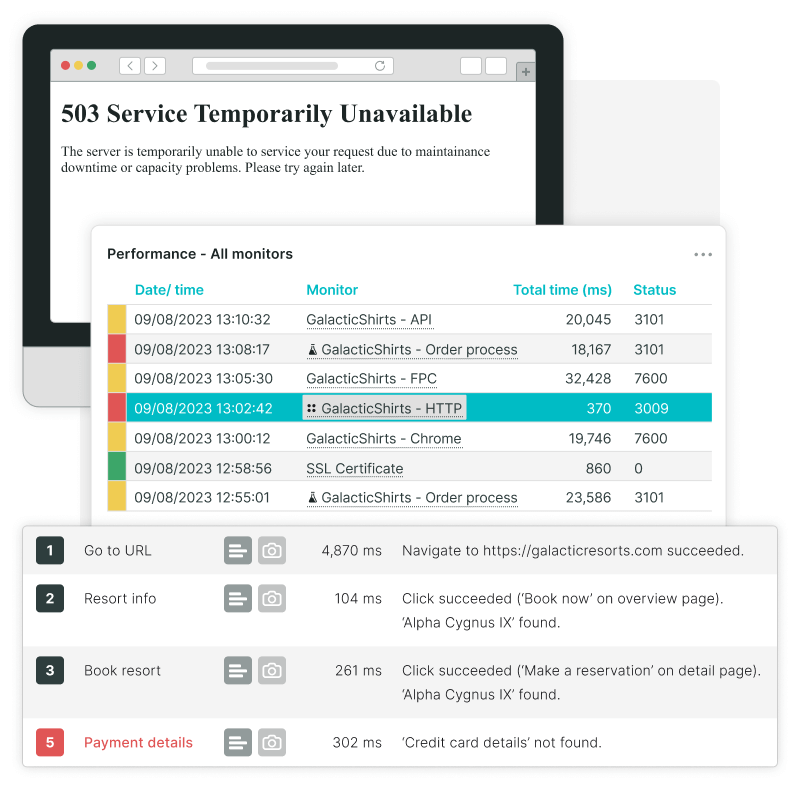
Vivid waterfall reports accessible via the monitor log dashboard provide granular data on page load performance and root-cause issues with transaction monitoring — details you can incorporate with data from other sources into your log analysis.
Create custom dashboards
Customize your dashboard to monitor relevant log data and maximize your time and efficiency. Dashboard drilldowns allow you to add specific tile types to monitor log data as you see fit.
Collaborate across teams
Share one or more dashboards with your team to further collaborative analysis. Control who can view and edit specific dashboards. Copy and modify charts created by peers with a few clicks of your mouse.
Share your reports with stakeholders
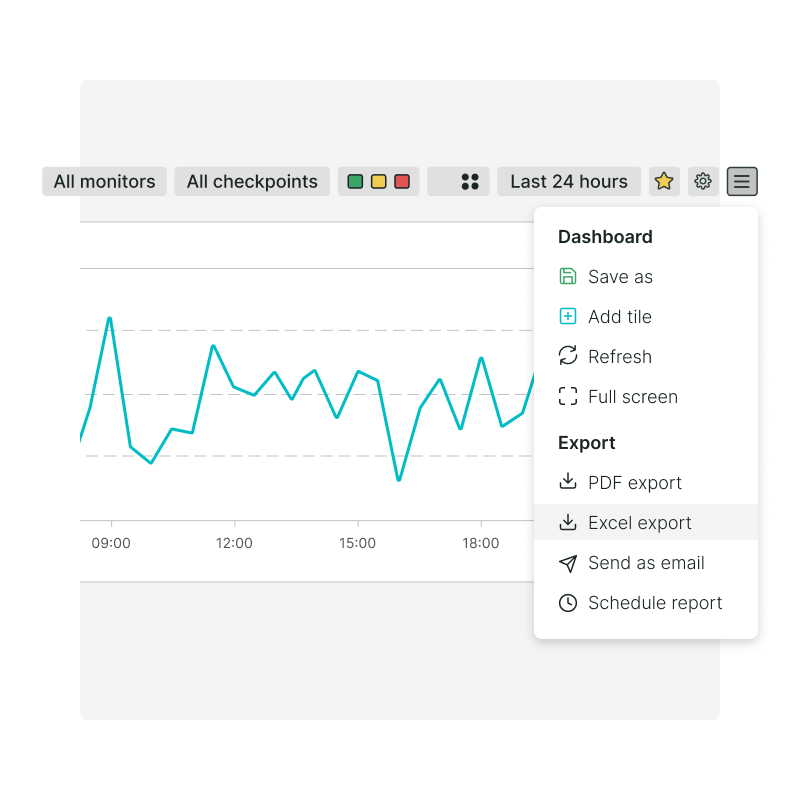
Turn log dashboard data into shareable reports in PDF or Excel format. Email reports to your stakeholders. Schedule and share reports for further analysis with DevOps teams via popular integrations, such as Slack, Microsoft Teams, PagerDuty, and more.

Leverage log analytics to reduce waste and cut costs
A good log analysis and reporting strategy comes with many benefits that contribute to better DevOps cohesiveness and better outcomes regarding the end user journey. Improve proactive monitoring outcomes and eliminate profit-eating bottlenecks before they affect customers and other end users.

Speedier analytics at scale
Get super-fast search response times for any volume of log data. Easily segment data to suit your needs. It’s now easier than ever to search, filter, focus on areas of interest — as well as create customer dashboards and alerts.
Rapidly detect patterns and anomalies in log data
Analyze bucketloads of log messages with a single click to reduce manual querying and identify root-cause roadblocks leading to poor end user experiences. Easily create queries, alerts, and dashboards for deeper analysis.
All log data in one place
One tool automatically corrals log events in your web applications, infrastructure, APIs, and devices with less hassle. Uptrends’ Log Analysis and Reporting dashboards are both intuitive and feature-rich.
Work smarter, not harder
Find exactly what you need with a lot less trouble. Logs are easily accessible — in one tool. No need to dig through logs in multiple tools to manually correlate errors and traces.
Empower DevOps teams to innovate
Uptrends’ Log Analysis and Reporting enables teams to get in front of root-cause and system performance issues, freeing up time to focus on innovation instead. Understanding logs in the context of your full stack, and user impacts, can lead to deeper insights furthering more time for new ideas and problem-solving solutions.

Meaningful insight when and where you need it
You can test all reporting features for free during a period of 30 days. And, pssst… we don’t need your credit card, and your trial expires automatically, so there’s no commitment at all!
Try Uptrends for free