Your user experience starts with a page load
Maximize your uptime
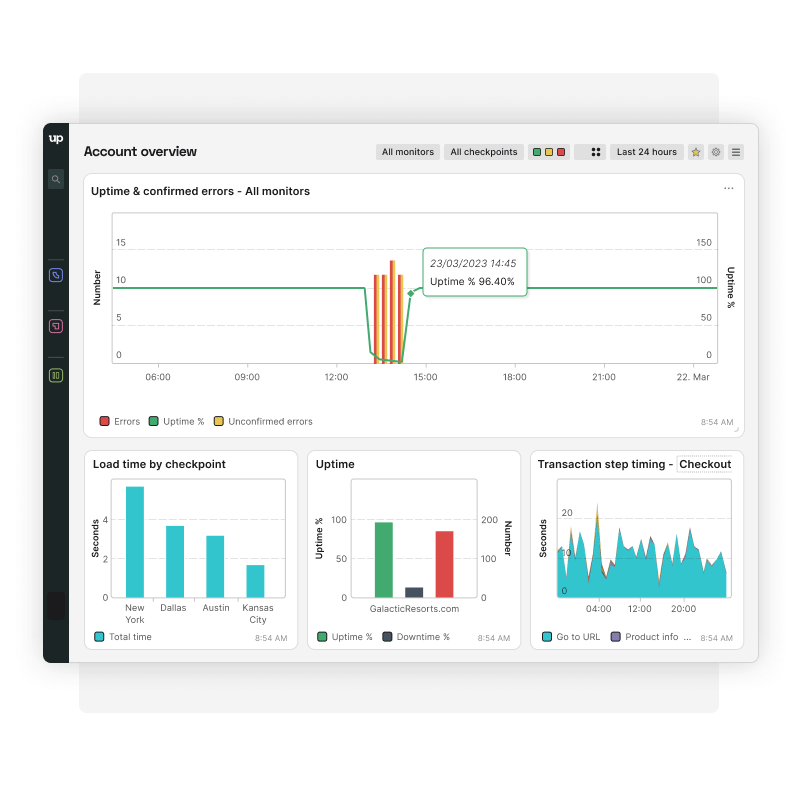
Your users expect your website to be available around-the-clock. Uptrends helps you deliver on that expectation, monitoring HTTP(S) , web services ( SOAP , REST API , SSL Certificates, DNS, and servers, alerting your team instantly.
Optimize for performance
Nobody likes a slow, inconsistent website. Utilize website performance monitoring , track slow first/third-party page elements, and view rich waterfall reports to help prevent failures and downtime , using Uptrends’ easy-to-use tools.
Maintain critical transactions
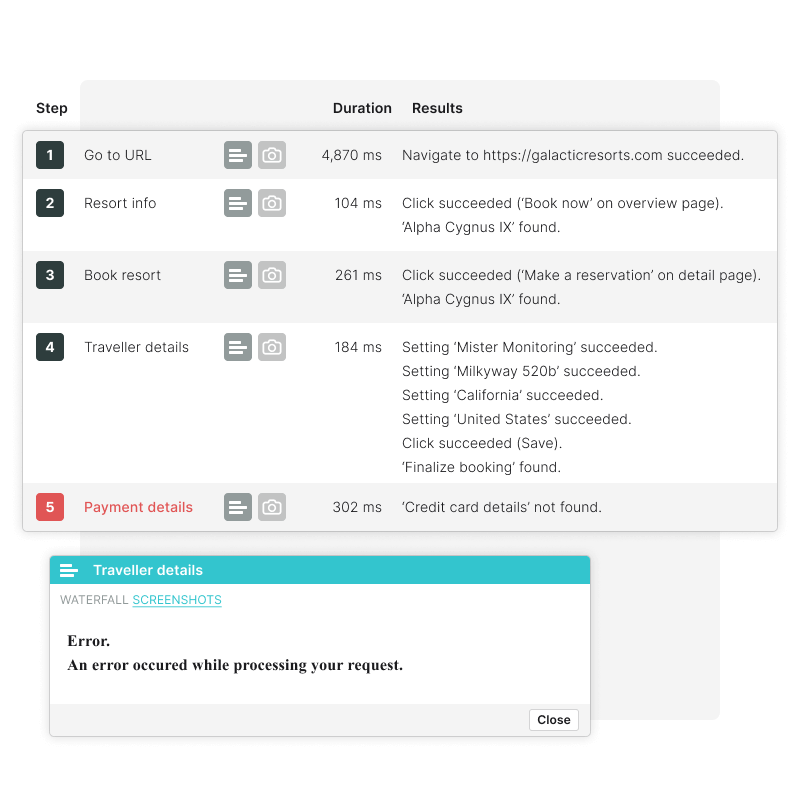
Don’t lose revenue because of a broken website interaction. With Web Application Monitoring you can monitor your website’s multi-step transactions for uptime and performance, delivering instant alerts and data the moment your search, forms, and logins fail.

“Before Uptrends, we didn’t have insights into our real uptime, but now we do.”
Capture data from the user’s perspective
Monitor your site with Uptrends' Synthetic Monitoring technology that utilizes a real browser. This tech spins a browser from a dedicated server, to render a webpage locally the same way your users do.
Uptrends empowers you to monitor your website from 233 checkpoints located globally. No matter where you are in relation to your users, you always know if they are experiencing downtime or performance problems.

Bandwidth Throttling
Your users won’t always have a great internet connection. Simulate lower bandwidth connections and output load times and speed metrics.
Public Status Page
Share your service status with the public with a Public Status Page . Add your own logo, and choose a color scheme that matches your brand.
Interactive Charts
Zoom in on the fine details, or select specific date and times to get a closer look at your data and spot trends in your website uptime and performance.
Error Snapshots
Want to see what your users see when your site goes down? Error snapshots show you what an error looks like in your user’s browser.
A Visionary in the 2024 Gartner® Magic Quadrant™ for Digital Experience Monitoring
Discover why ITRS has been recognized in the first-ever Magic Quadrant for Digital Experience Monitoring.

Test core functions like logins and signup flows
Record critical transactions directly in the browser with Uptrends' Transaction Recorder , or build and edit scripts with the code-free editor. Your user flows are executed in a real Chrome browser every 5 minutes, ensuring your users can actually use your website all the time. You can even run checks from behind your firewall with Private Checkpoints .


“Correlating the developers' changes with performance changes in Uptrends makes analyzing the situation easier.”
Test if your APIs work as intended
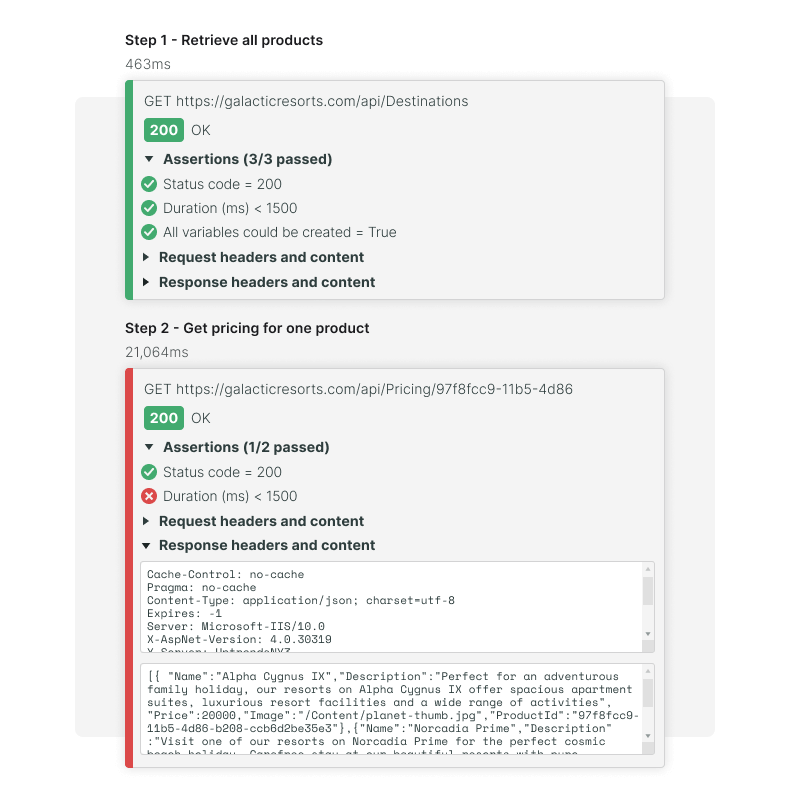
If your APIs fail, your websites fail. That’s why it’s crucial to know about API errors as quick as possible. With API monitoring , you can chain API calls and HTTP requests step by step, to test your APIs from end to end.

Understand website problems at a glance
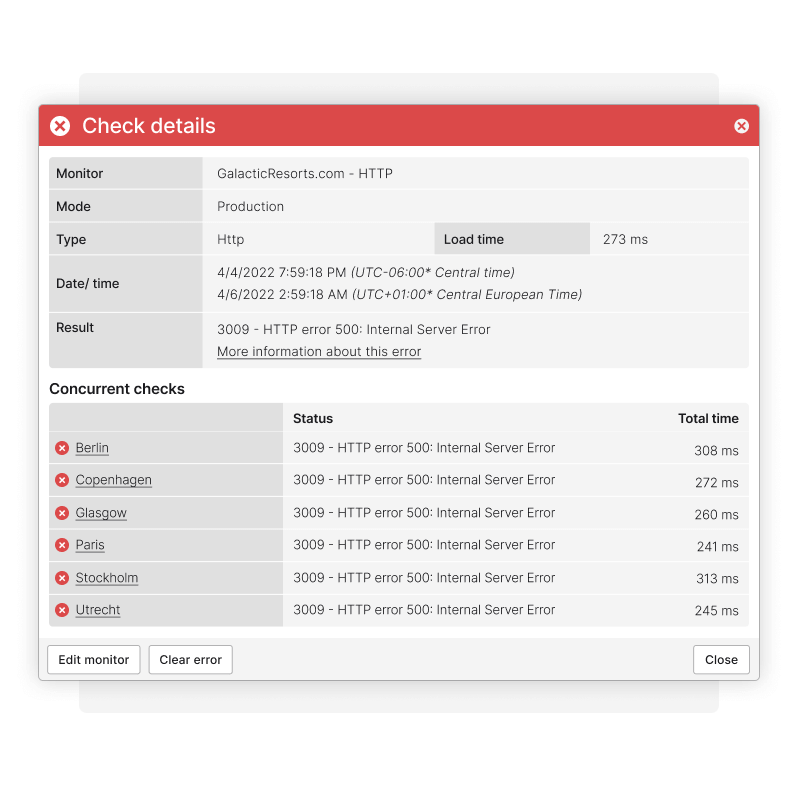
Concurrent Monitoring makes checks from multiple locations all at the same time. You’ll get loads more data, and with error thresholds, you can get alerting sent right away without waiting for a confirming check. Concurrent Monitoring is available for all synthetic monitor types.
Hearing about website downtime or performance problems from a user can be embarrassing. With customizable SMS, phone, and e-mail alerting (and push notifications with our free mobile apps ), you can ensure that you are always the first to know when the unexpected happens.

Try Uptrends Website Monitoring free for 30 days!
Getting started is easy—just sign up, choose what you’d like to monitor, and go!
Get started — it’s freeQuick take-aways in PDF format?