In a fiercely competitive business environment, you need to be able to make sense of your monitoring data to make the best strategic decisions. Get the high-level, condensed reports on performance and availability that you can share with IT and site reliability managers to help drive business profitability.
Management tools at your fingertips
Traditional problem-solving skills are not enough to manage today’s complex network monitoring landscape. Zero in on the right resources you need to manage your SRE team’s response time to outages, deliver exceptional site performance to end users, and save time and money.
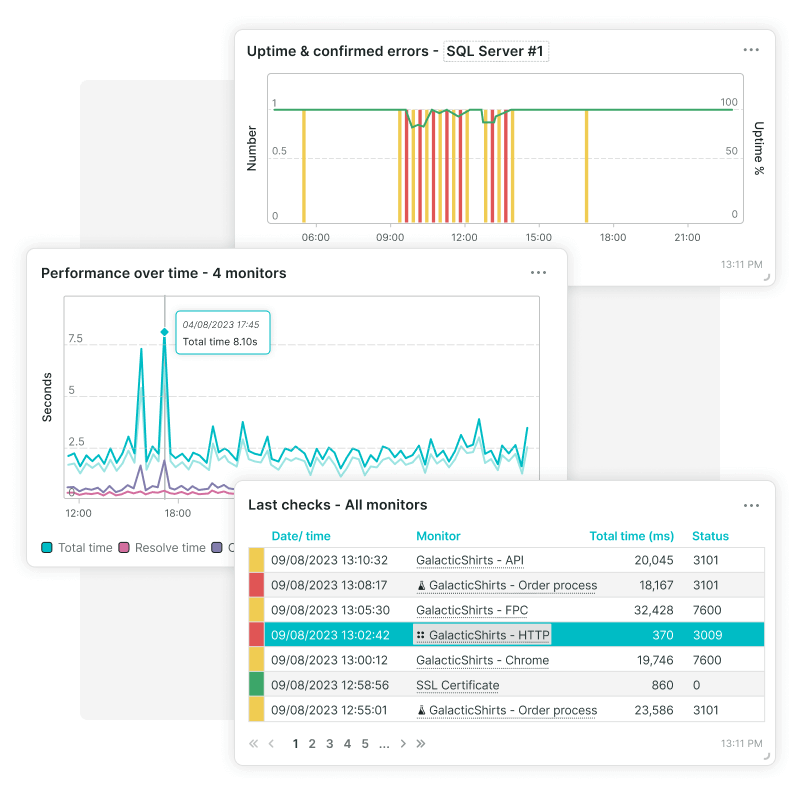
Customizable dashboards for full overview
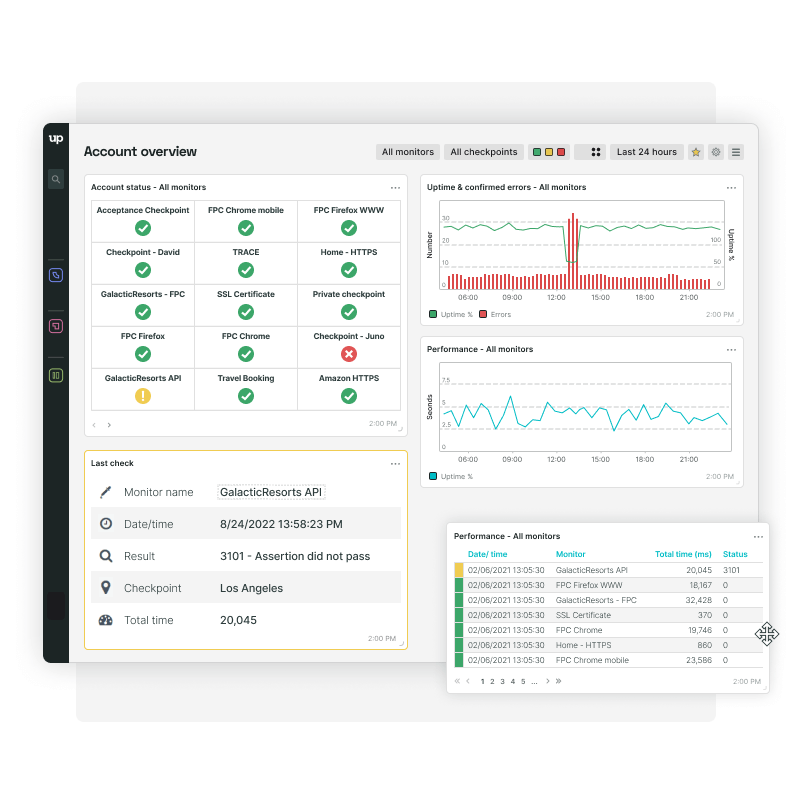
Data visualization can be powerful tool when all the moving pieces come together. Easy-to-comprehend dashboards provide your IT teams with the data that matters most to helping you solve complex management challenges.
- Create multi-tiled dashboards as you see fit, duplicate existing dashboards, or create one from a template.
- Gather user experience data based on the user’s device, operating system, browser, connection, and location.
- Leverage fine-grained performance data with analysis, error, and status dashboards.

“It’s kind of a turnkey solution. We were able to just jump right in and put Uptrends in use immediately.”
Keep track of performance and availability KPIs
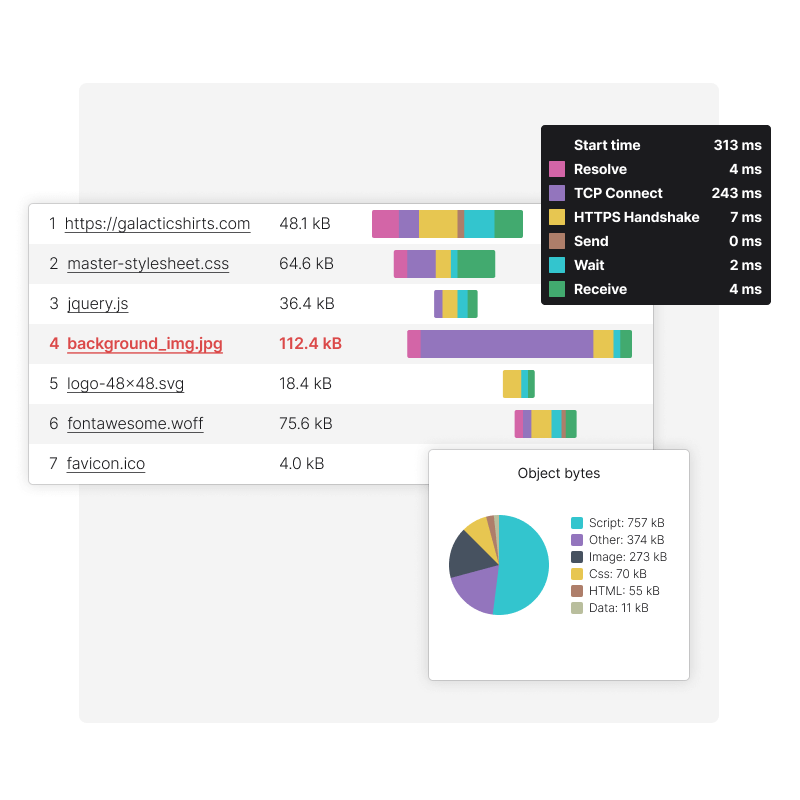
Performance and uptime KPIs are essential across the board. View performance KPIs on a per-check basis in your check detail reports, or how they perform over time with Uptrends' Web Performance Monitoring.
Your website is checked from one of our 229 global checkpoints to accurately reflect your users experience. You can inspect all page elements down to the nitty-gritty with waterfall reports and even measure your Core Web Vitals and W3C metrics.
Know that your SLA metrics are being met
Uptrends comes with a default SLA overview dashboard to check your SLA compliance at a glance.
- Record and share important SLA metrics with other management stakeholders.
- Export PDF and Excel reports to forward SLA data easily.
- Receive SLA reports in your inbox by scheduling e-mail reports (on a daily, weekly, or monthly basis).
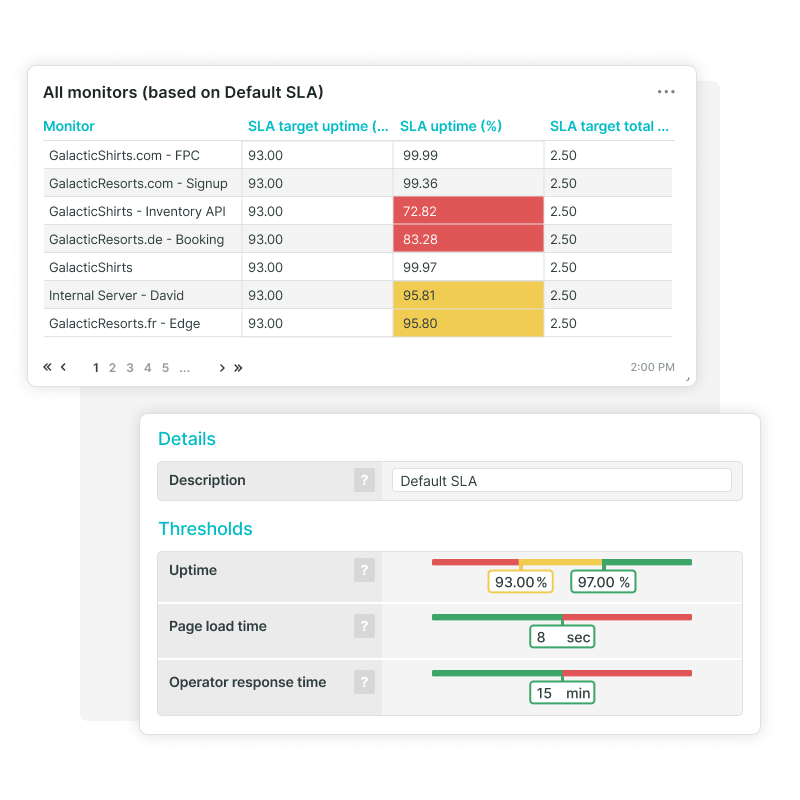
SLA target uptime and SLA uptime
Set SLA target uptime percentage goals then measure actual uptime percentage taking into account any excluded days or times set up in your SLA definition.
SLA target total time and SLA total time
SLA target total time is the maximum amount of time in seconds that a page can take to load and remain in SLA compliance. Compare with the actual average load times for the period in seconds.
SLA operator response time target
The SLA operator response time target is the maximum amount of time allowed for an operator to confirm an issue in Uptrends, and SLA operator response time is the actual amount of time taken.

“… if Uptrends indicates that we are getting close to not meeting our SLA, we know where we need to focus our attention.”
Keep agile APIs up and running
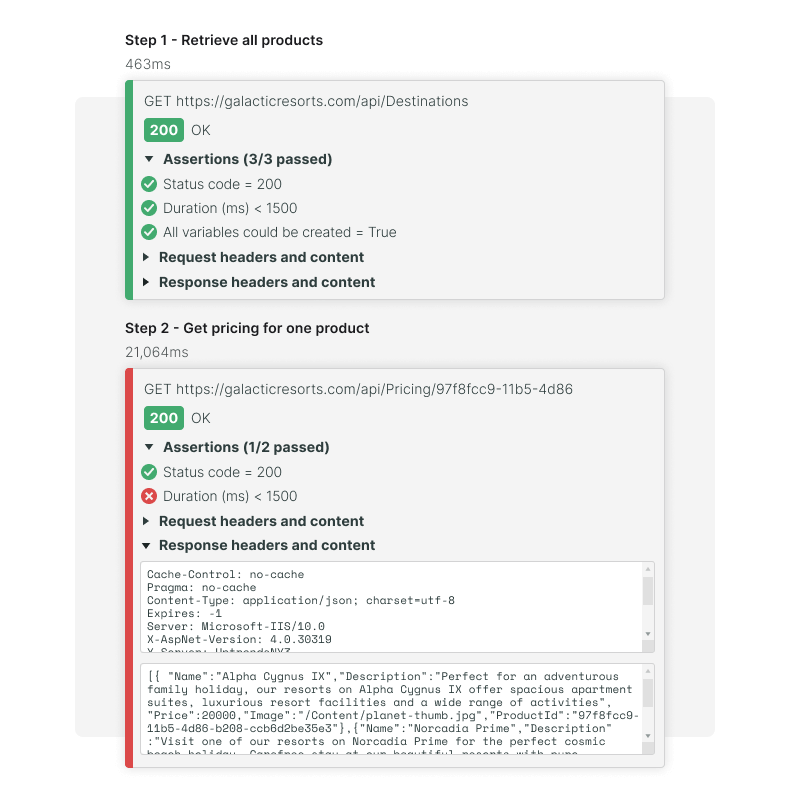
Uptrends’ Multi-step API Monitoring brings issues directly to the forefront from both internal and third-party APIs that power your applications. Check your business-critical APIs for performance, function, and uptime.
With our container-based Private Checkpoints, you can even monitor your internal APIs from behind your firewall.
Check for performance
Check the performance of every request and set assertions for maximum response times. View long-term trends in your performance dashboards.
Verify API functionality
Test redirects, authentication, perform CRUD, or any other API interaction. Monitor for result codes, and check if your API returns expected content.
229 global checkpoints
Monitor your APIs from one of our 229 worldwide checkpoints. Combined with Concurrent Monitoring, you can test from several locations simultaneously.
Get alerted immediately
With tests as frequent as every minute, you will know the moment your API is in trouble with Uptrends' alerts and third-party integrations.
Remove revenue-killing blind spots
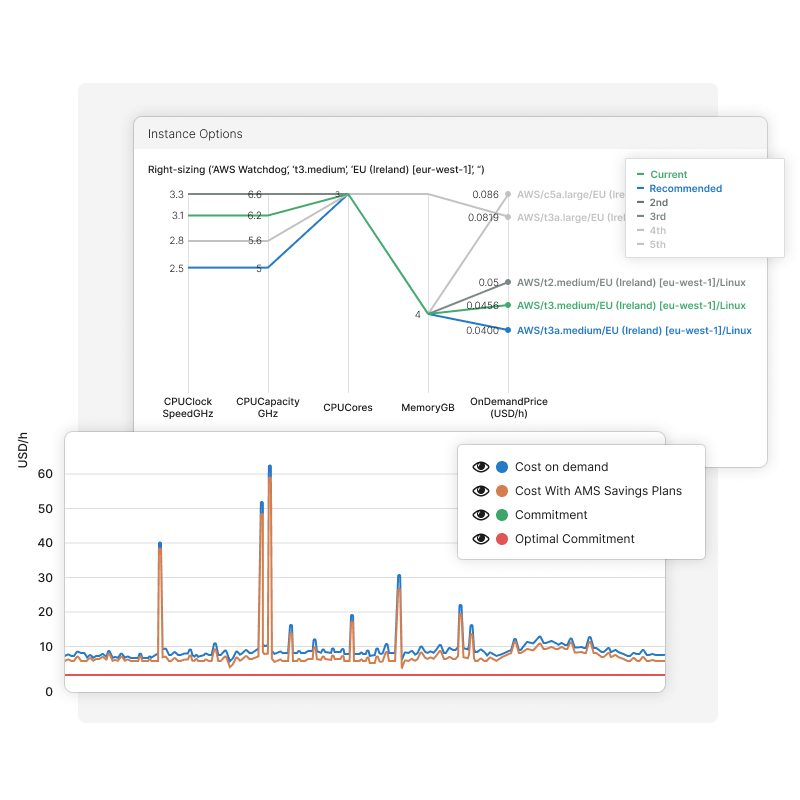
At the end of the day, your goal is to drive more revenue and provide more performance at less cost. Unfortunately, some companies experience blind spots costing them substantial amounts of revenue without knowing their source.
With Cloud Cost Management you’ll begin to see where you can enhance performance and where you can reduce overspending on cloud allocations.
Know your web applications work every time
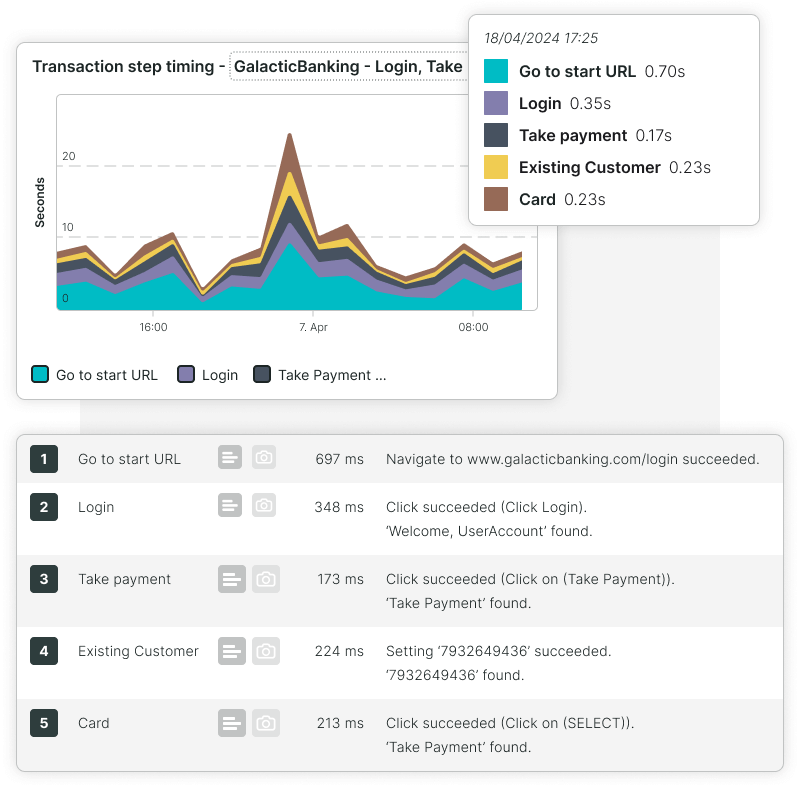
Protect your transactions with Web Application Monitoring by testing complete user scenarios, such as logging in, managing a shopping cart, and making reservations.
- Stay informed and confident that your web transactions keep working.
- Lower cart abandonment rates - 20% of abandoned carts are due to faulty checkout experiences.
- Build your brand, establish a good reputation, and drive more traffic; don’t let glitchy transactions ruin that.
Put Uptrends on your Management team
Give your IT and SRE teams the right monitoring tools for peak website performance. Spend more of your time focusing on managing your business for long-term growth. Start your free trial today! No commitment and no credit card required.
Try Uptrends free for 30 days